South Australia's generation record (downloaded 2022/12/19)
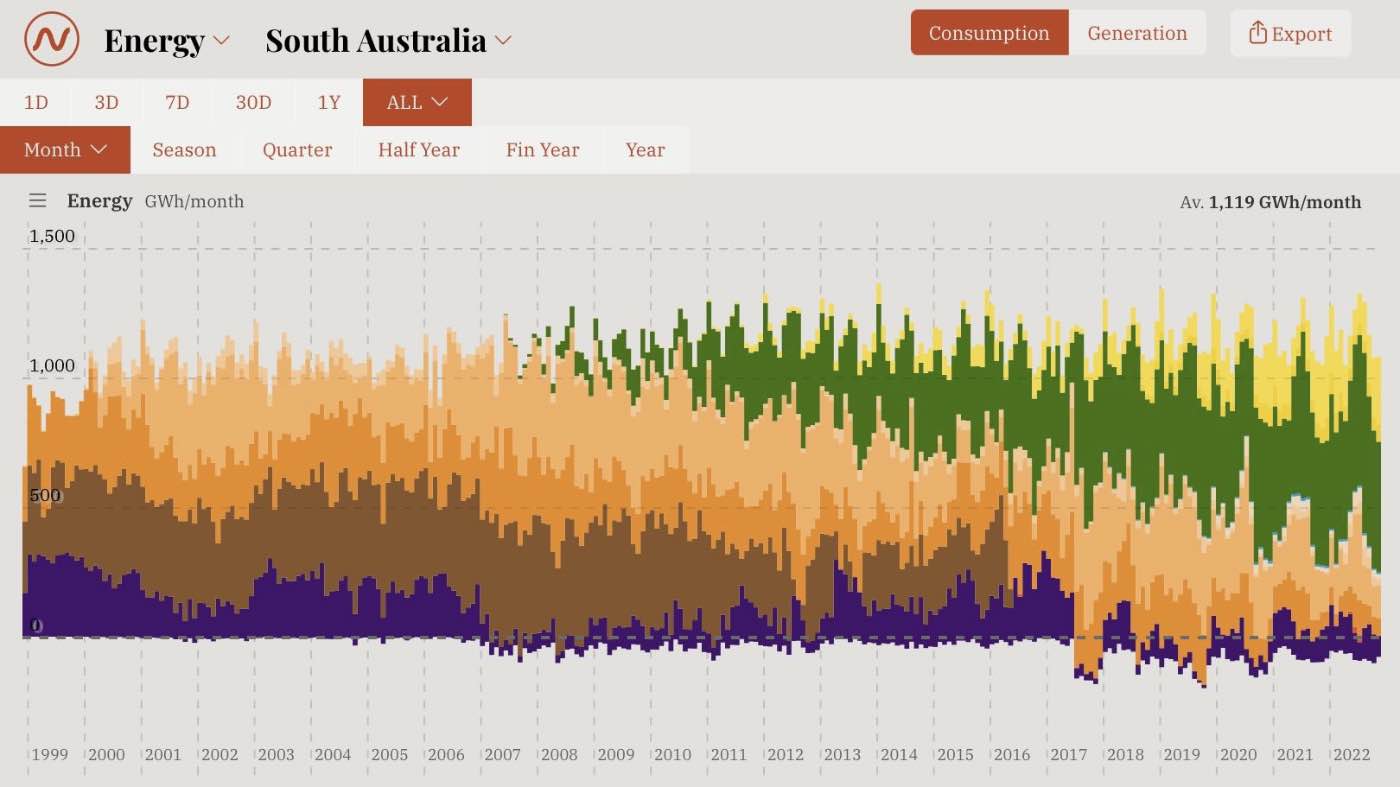
Image credit:
Open Nem
|
Recognition of SA's success by the Institute for Energy Economics and Financial Analysis and the World Economic Forum. These organisations held South Australia up as an example of what can be achieved in the move from fossil fuels toward renewable energy, June 2021.
A number of other sites recognising SA's achievements are listed in Related pages: external on this page. |
|
This page is updated and added to periodically.
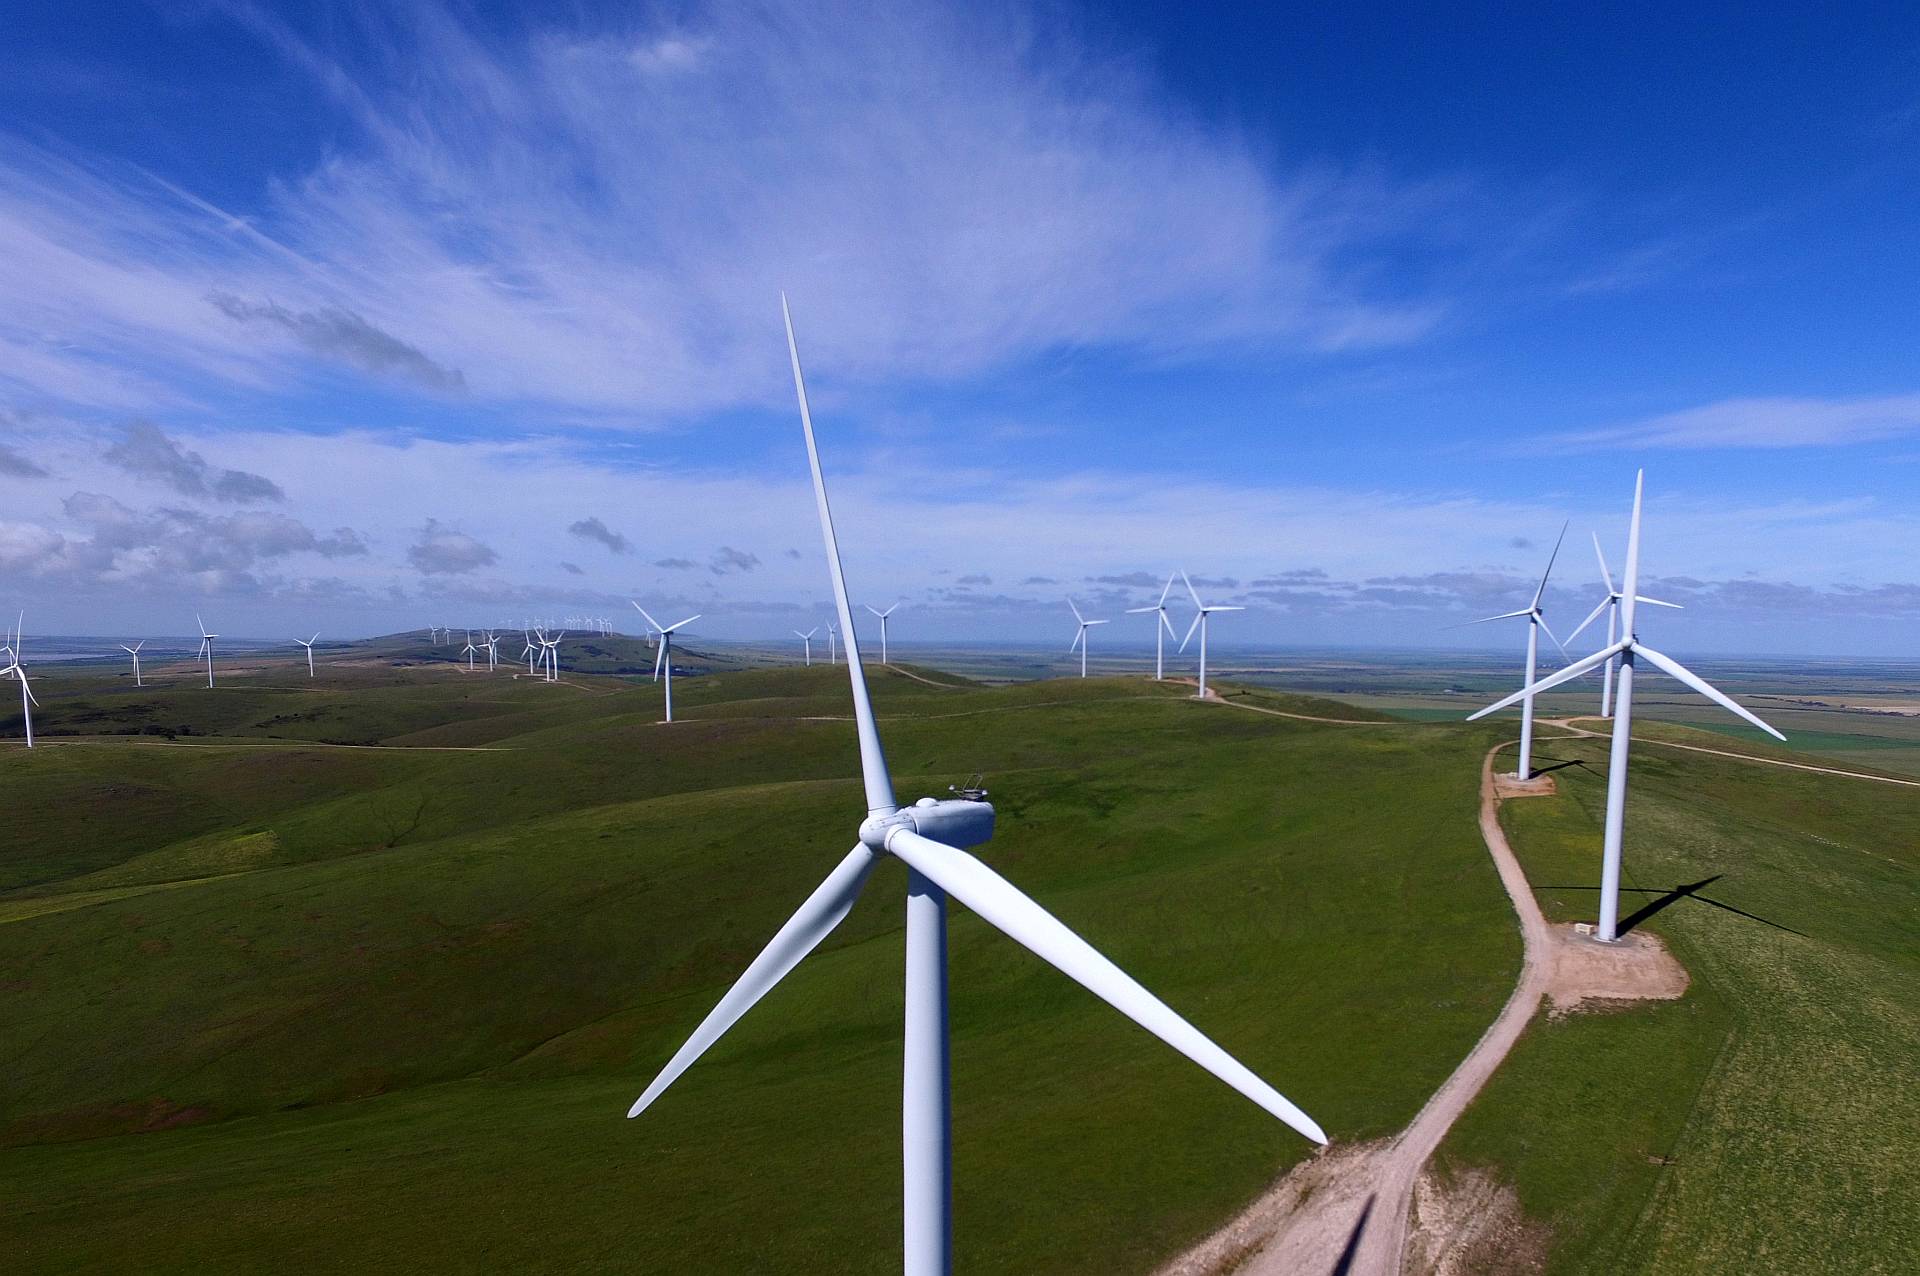
The writer of this page lives in South Australia among the
highest concentration of wind farms in the nation and is proud to be a supporter.
|
South Australia's generation record (downloaded 2022/12/19)
|
|---|
|
|
Image credit:
Open Nem |
I would like to express my personal thanks to the people who were responsible for the Open Nem website as well as all those who have helped South Australia achieve its huge success against the best efforts of the federal Liberal/National coalition to stop it all happening.
The need and South Australia's achievement
At least in the period from 2003 to 2017 South Australia has done far more toward reducing its greenhouse emissions than any other Australian state. The need for serious action on climate change was at the time of writing being demonstrated by Hurricane Harvey devastating big areas of Texas, record monsoonal flooding in India, Nepal and Bangladesh, record wildfires in Canada and western USA and Hurricane Irma producing unprecedented damage in the Caribbean and Florida. In addition to climate change there are the related problems of ocean acidification, sea level rise and the air pollution from the burning of fossil fuels that kills millions of people world wide each year. In 2017 all well informed, open minded people of at least moderate intelligent accept the reality of anthropogenic climate change, and with record storms, floods and wildfires and almost every year being warmer than the previous one the urgency of action in reducing greenhouse emissions is equally obvious. If other Australian states and other nations were to adopt renewables as enthusiastically as South Australians have done, and continue to do, future generations – our children and our grandchildren – would be able to look forward to a brighter future than they seem to be condemned to at present.
It would be well worth paying higher prices for clean energy, but the fact is
that renewable energy is in 2020 cheaper than fossil fuel-fired energy.
And the cost of renewable energy is continuing to fall.
SA leading the nation and the worldSnapshots of SA's electricity generationSouth Australia generates more than 100% of its electricity demand renewably over a whole week |
A week's electricity generation in SA, December 2022
|
|---|

|
|
The graph above records that 104.5% of South Australia's power demand was filled by renewable energy in the week 11th to 18th December 2022 (excess energy was exported to Victoria). For the last day in that period the figure was 114%.
In the year to 2022/12/18 two thirds of SA's demand was generated renewably; 45.8% wind and 21.8% solar. The solar power was made up of two parts: 16.9% of the state's demand was filled by roof-top solar, 4.9% utility solar. Note the low proportion of gas power in the system. A few years earlier AEMO required a larger proportion of gas fired power for system stability. By 2022, following the installation of synchronous condensers, it has been found that a proportion of gas as low as 4% is workable. |
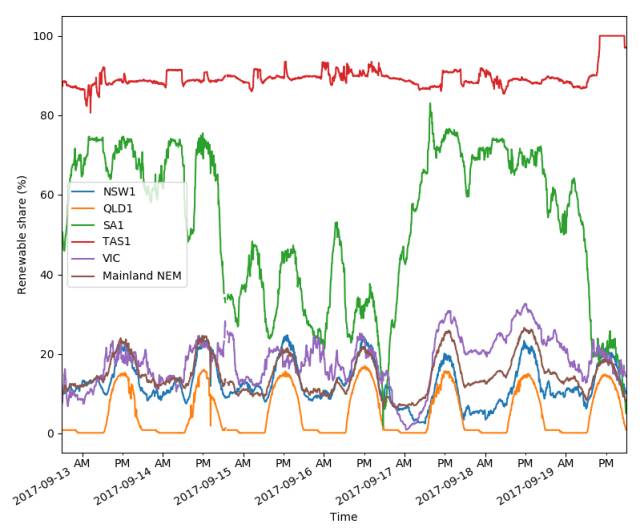
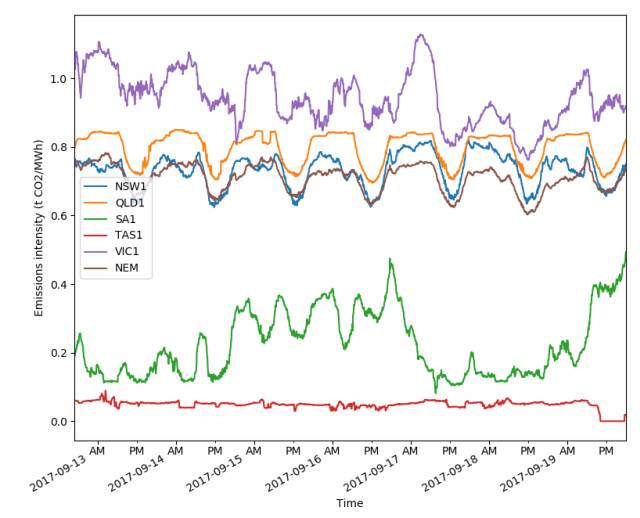
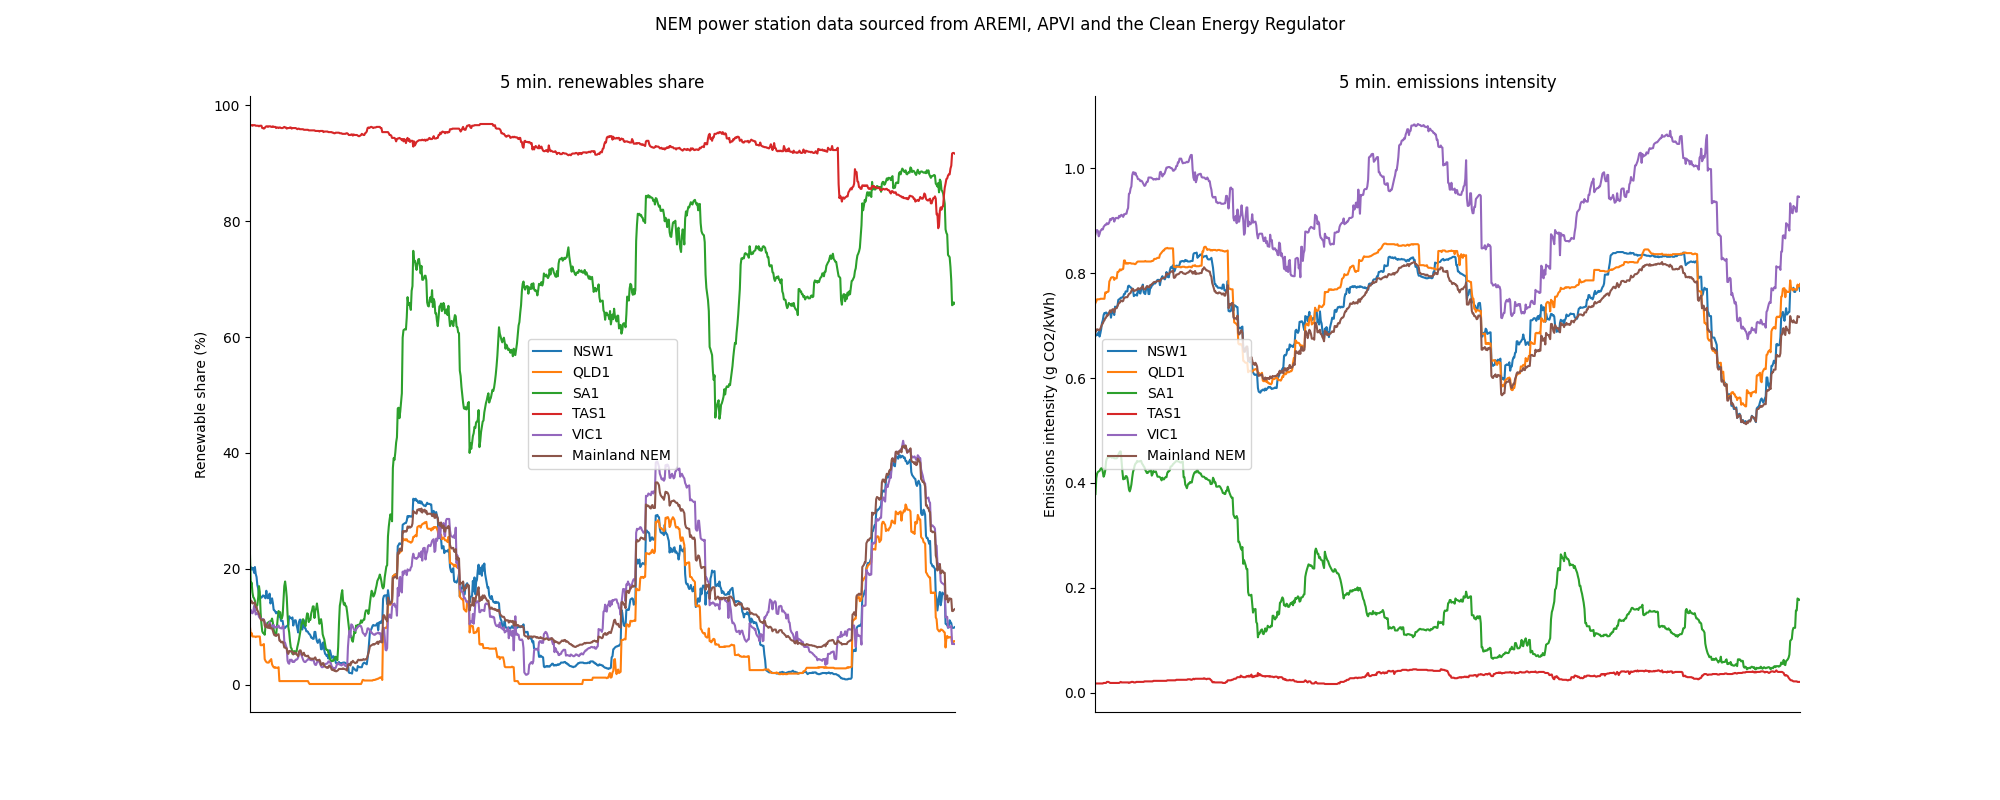
A high level of renewable generation and low levels of emissions
They provide yet more evidence that South Australia's adoption of renewable energy has been a huge success. The first graph, renewables share, shows that SA, which had practically no renewable energy 14 years earlier, had a very substantial proportion in September 2017. The second graph, emissions intensity, shows that South Australia, through its adoption of renewable energy, had power-sector emissions at a lower level than any other mainland state. South Australia has moved far more in reducing its emissions, in a world in which reducing emissions is becoming almost daily more obviously needed, than any other Australian state. Other states, and Australia as a whole, should be using SA as an outstanding example of what could be done and what should be done in this world that is increasingly being damaged by climate change. The graphs have been made available, and self-funded, by Ben Elliston. Thank you Ben.
Tasmania had by far the lowest emissions of any state due to its high level of hydro-power, which had been in place for twenty or more years. Victoria had the highest emissions because it relied on particularly polluting brown coal, while NSW and Queensland burned black coal.
The fact that Queensland had virtually no wind power but a moderate amount of solar power was obvious in the daily peak in renewables share and the daily trough in emissions.
SA 70% renewables powered in 2023
Open NEM showed that in the year to September 2023 just over 70% of SA's power demand was generated renewably: 45.5% wind, 19.1% roof-top solar and 5.6% utility solar.
| |||||||||||||||||||||||||||||||||||||||||||||||||||||||||||||||||||||||||||||||||||||||||||||||||||||||||||||||||||||||||||||||||||||||||||||||||||||||||||||
|
The Executive Summary of the report started with:
"South Australia (SA) is a window into the future of an electricity grid dominated by wind and solar, and backed up by storage. Lessons from South Australia can help inform other jurisdictions on how to integrate large amounts of variable renewable energy (VRE) generation and distributed energy resources (DER) into the electricity system. This report presents seven key lessons from the South Australian experience for other states and nations that are transitioning from a fossil fuel-based grid to a low emissions, high renewables penetration grid."and contained sections under the following headings:
The World Economic Forum produced a Web page titled '7 renewable energy lessons from South Australia' on 2021/06/14 based on the IEEFA report. The author was Sean Fleming and the page was dated 2021/06/14.
|
|
|
|
The truth is that while there are certainly challenges in adopting high percentages of renewable energy, South Australia has had no serious problems that could be ascribed to the intermittency of wind or solar power and, with the exception of blackouts that were caused by storms, has had a very smooth transition from near zero to 50% renewables (to 67% by 2022).
Of course climate change has been shown by scientists to make storms more violent than they would otherwise be, so if anyone should be blamed for SA's power blackouts it should be those who oppose taking serious action to reduce climate change.
In August 2017 Prime Minister Turnbull accused the South Australian government of "ideology and idiocy" for their support for renewable energy.
Since the state government's support for renewable energy is no more than
any reasonable person would believe is justified and the state's adoption of
renewable energy has been a great success, I accuse PM Turnbull of
ideology, idiocy and criminal behaviour in his support of coal and opposition
to renewable energy to the detriment of the planet and all future
generations.
|
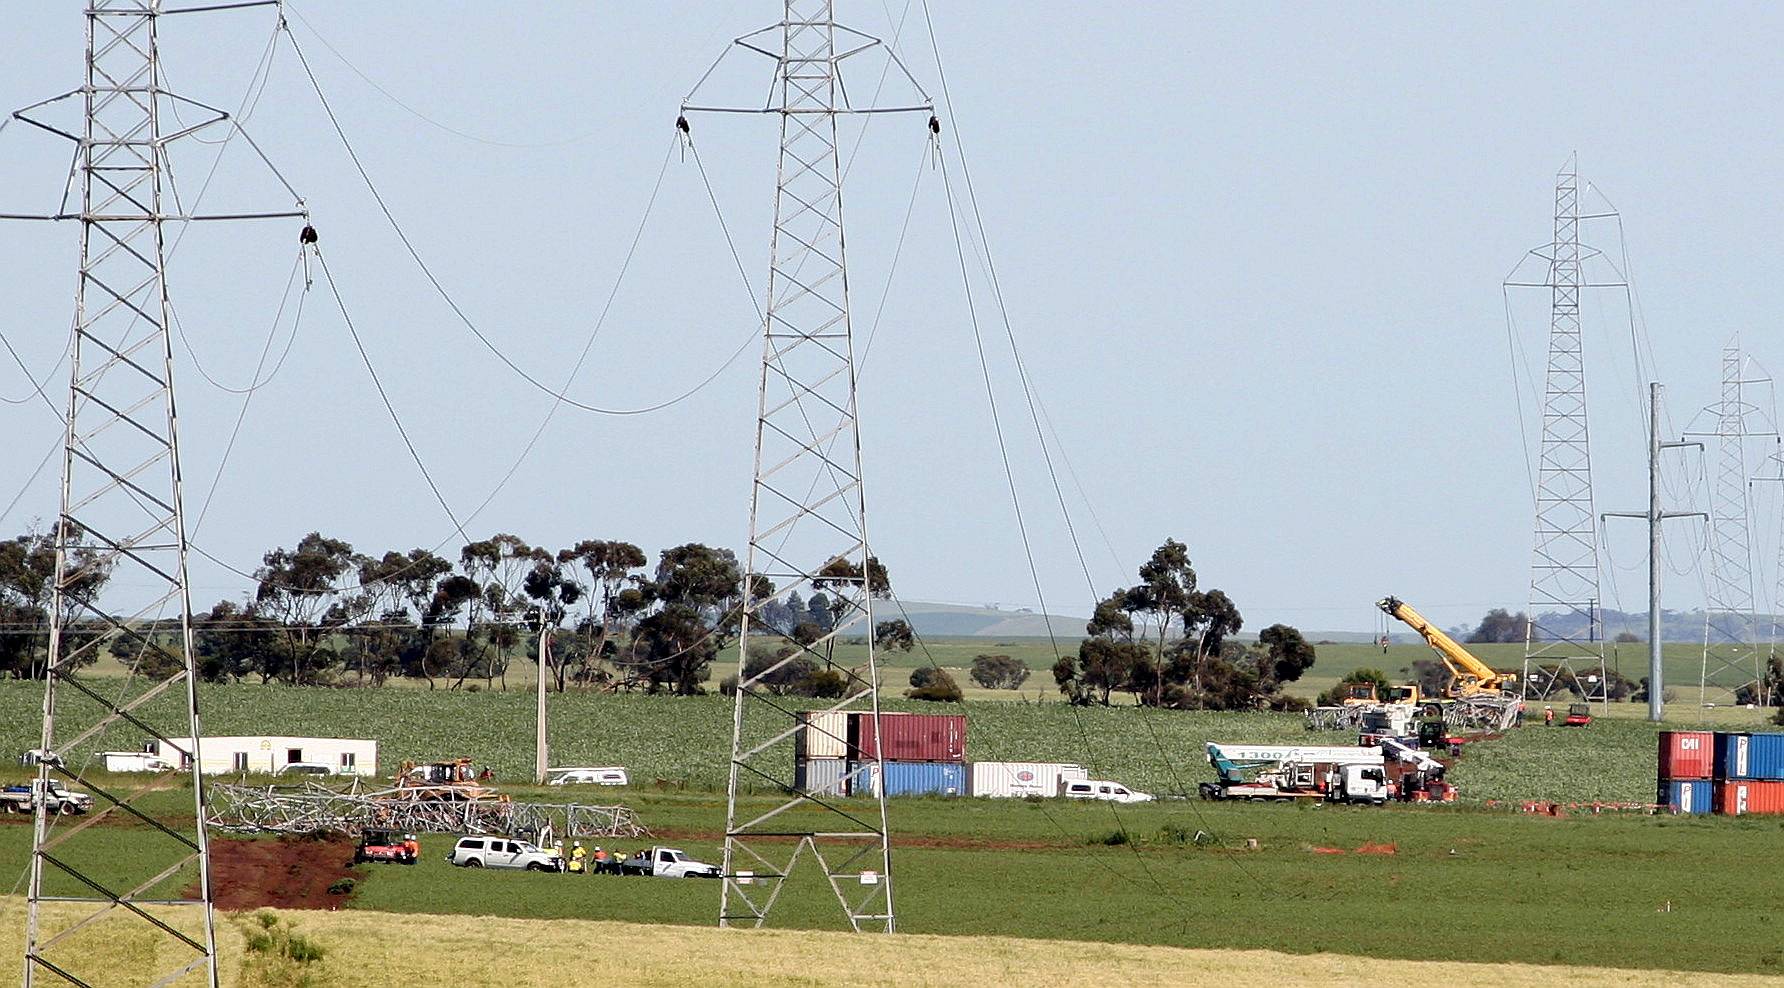
|
The AEMO report stated that: "Due to the nature of the damage to transmission equipment in Victoria, the extended South Australia island was not reconnected to the rest of the NEM until 17 February 2020."
In the context of this page it is notable that the 'islanded' area ran quite successfully without any support from coal-fired or other base-load power stations for the 17 day period.
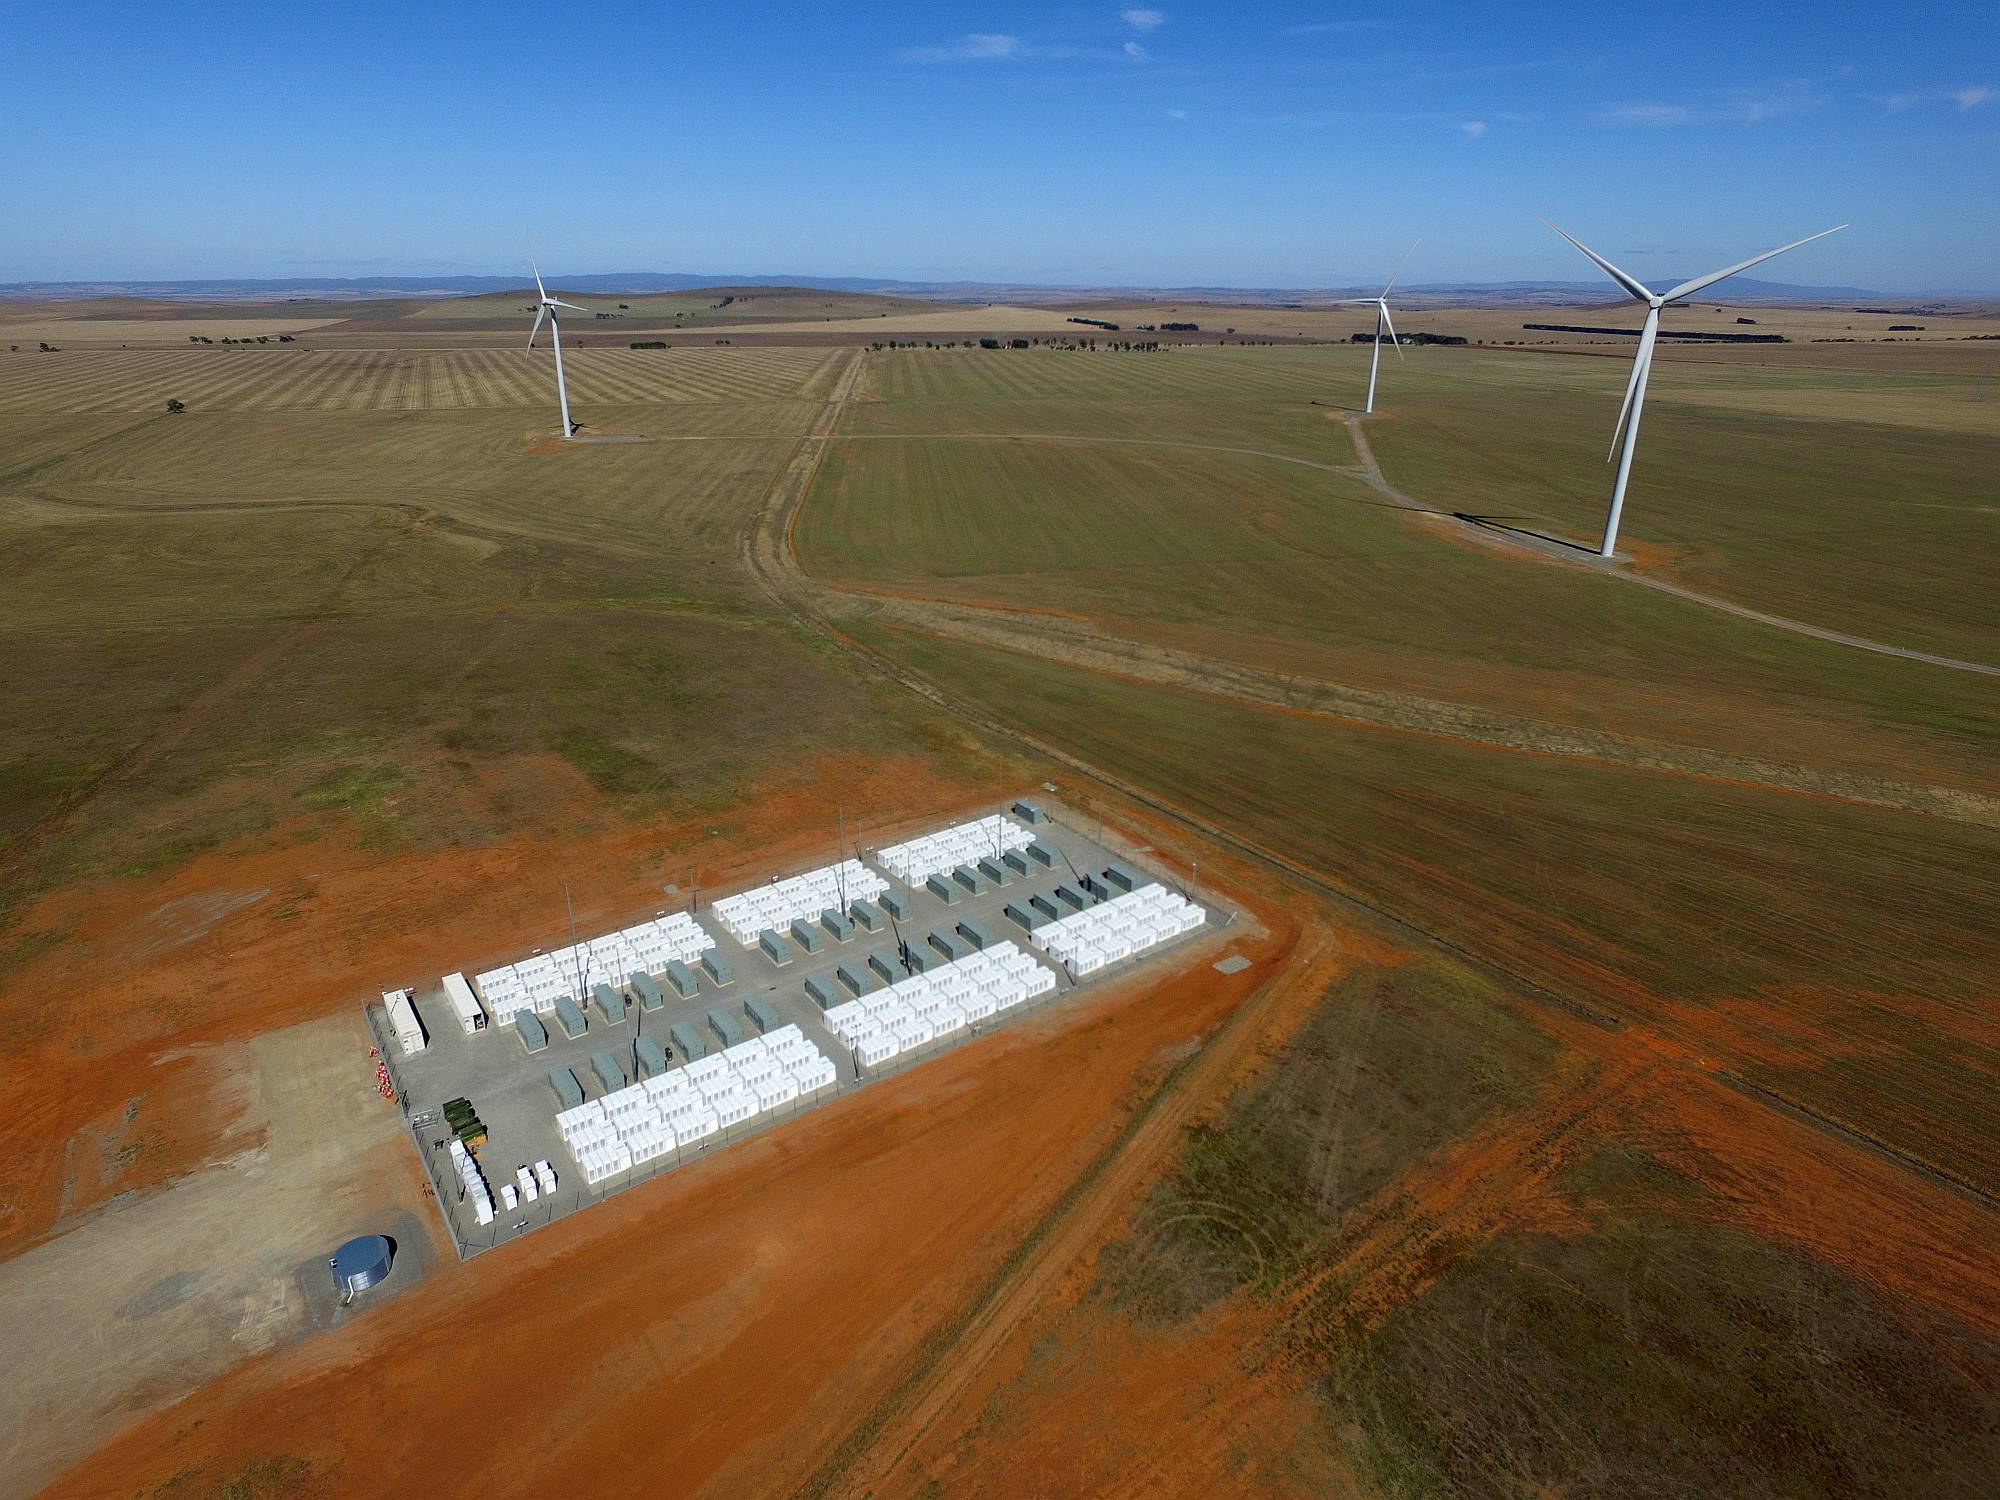
|
“By all means, have the world’s biggest battery, have the world’s biggest banana, have the world’s biggest prawn like we have on the roadside around the country, but that is not solving the problem,”Morrison said Tesla boss Mr Musk was clearly very good at promotion. “I think he saw [South Australian Labor Premier] Jay Weatherill coming.”
Time has shown the Hornsdale Power Reserve, like South Australia's wind power developments, to be a great success.
For a Federal Treasurer to be so greatly in error, or willingly dishonest, in an important financial matter is quite shocking.
Scott Morrison later became Prime Minister and lead what was quite probably the worst government in Australia's recent history.
|
|
|
According to the Australian Energy Regulator the annual volume weighted average spot prices on the wholesale electricity market in SA have risen more in the period during which the state developed its renewable energy than in Queensland, but less than NSW and much less than Victoria.
| Average wholesale spot prices from the Australian Energy Regulator and percentage rise in average spot prices in the period during which SA developed most of its renewable energy. Prices in dollars per megawatt-hour. | |||||
|---|---|---|---|---|---|
| Period | Qld | NSW | Vic | SA | |
| 5 year average before renewables | July 1998 to June 2003 | $46.6 | $34.2 | $33.4 | $51.4 |
| 5 year average following development of substantial renewables | July 2014 to June 2019 | $77.2 | $71.0 | $75.0 | $93.8 |
| Percentage rise | 66% | 108% | 125% | 82% | |
It is also notable that in the year to the time of writing this section (September 2019) SA has exported nearly twice as much power to Victoria than it has imported, suggesting that wholesale prices in SA have become generally lower than those in Victoria. In addition, the ratio of exports to Victoria to imports from Victoria has been steadily increasing since late 2016. See OpenNem.
|
|
|
|
When the sun is not shining (more accurately, when the light is not bright, solar power is also generated under cloudy conditions) the wind may be blowing and wind power abundant; as in the right-hand side of the image on the right.
When the wind isn't blowing there may be abundant solar energy, as in the left-hand side of the image.
In South Australia at least it has been noted that winds tend to be stronger at night than in the day.
In this particular 24-hour period 30% of the state's power was generated by solar PV and 39% by wind power; 69% total renewables. Batteries provided 0.6% of the state's demand; expect to see far more energy storage in the future.
|
|
|
After studying nine years of power outage data the authors found that while outages were more frequent during hot weather the causes were far more often in the power distribution system than due to a short-fall in generation (contrary to statements from supporters of coal power). Quoting from the Conversation article:
"There have been generation shortfalls in Australia on only three days in the past fourteen years, whereas there are network failures every summer all around the country, every year."
|
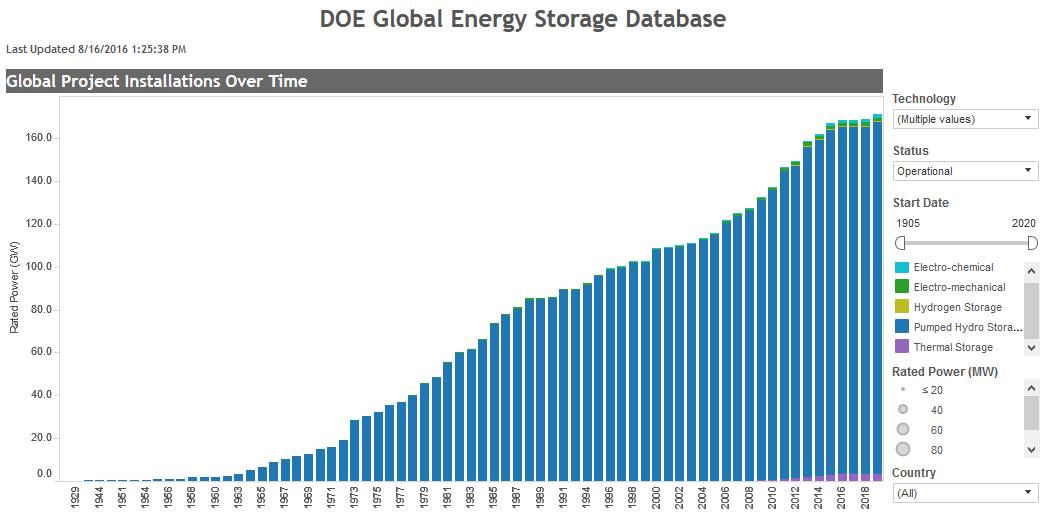
USA Department of Energy graph
|
|---|
|
This shows clearly that the vast majority of the world's energy storage in 2016 was in the form of pumped hydro.
Much of it was built to allow power grids dominated by inflexible
nuclear power to respond to variations in demand. |
|
If Australia is to replace substantial proportions of its fossil-fuelled power stations with renewables we must greatly increase our amount of energy storage; pumped hydro will have to provide a large part of this.
There is little pumped hydro energy storage in Australia, only three operating installations so far as I know. PM Turnbull has proposed a huge pumped hydro scheme in the Snowy Mountains, but that will at least take years if it ever comes to anything.
South Australia is looking like taking the lead here too, with the government announcing investments in four projects in February 2018. For more information see Energy Source and Distribution News, 2018/02/09.
|
|
| ||
| ||
|
At the time of writing, in early 2018, an obvious contender was electricity stored in batteries. The limitation here is the cost of batteries; at present an electric car in Australia comes with a price about twice that of a similar sized ICE- (internal combustion engine) powered car. Also, batteries are not suitable as a means of transporting large amounts of energy from one place to another.
An alternative to batteries for energy storage and transportation is hydrogen, which weight-for-weight stores more energy than traditional liquid fuels. To the present there have been several major technical problems with hydrogen:
The ABC's Nick Harmsen wrote about a Hydrogen-fuelled power plant planned for Port Lincoln in South Australia on 2018/02/11. Meanwhile, the CSIRO have developed a method for collecting the hydrogen following the dissociation of ammonia. See Renewable hydrogen could fuel Australia's next export boom after CSIRO breakthrough ABC, Rebecca Turner, 2017/05/12.
A second renewables-to-gas hydrogen plant was announced in February 2018, this one in Tonsley, an Adelaide suburb; see the article by Sophie Vorrath in Renewable Energy.
|
|
The overall result was 69% support, 14% opposed and 17% undecided.
There was strong support for the renewables target even among Liberal/National party voters: 60% support, 25% opposed, 15% undecided. Support from other parties was significantly higher at 77-79%, with the unsurprising exception of Pauline Hanson's One Nation Party. (Interestingly, another poll indicated that voters could be ranked from most to least altruistic in the order: Greens, Labor, Liberal/National Coalition, One Nation.)
This poll emphasises the basic premise of this page: South Australia's transition toward renewable energy has been a great success.
|
|
|
The graph below, recorded on 2016/08/20, a month or so before the power outages, shows 90% renewable energy in SA's generation. I don't think that this was very uncommon, in fact, renewable generation in SA occasionally reached 120% of consumption, as recorded in the Electranet document mentioned below under synchronous condensers. (The excess generation would have been exported to the eastern states.)

|
After this time when wind power generated more power than was needed to get to the 80% some of the wind farms had to be 'curtailed'; that is, had to reduce the amount of power they put into the grid. This, of course, reduced the economic viability of the wind farms as well as meaning that more fossil fuels were being burned than necessary.
Quoting from Electranet's page:
"A secure power system needs adequate levels of both system strength and inertia, which to date have been provided by synchronous power generation. System strength relates to the ability of a power system to manage fluctuations in supply or demand while maintaining stable voltage levels. Inertia relates to the ability of a power system to manage fluctuations in supply or demand while maintaining stable system frequency.
Both are important to ensure secure supply for customers. If there is not enough of these services within the power system, there is an increased risk of system instability and supply interruptions."
Electranet's page defines synchronous condensers as:
"A synchronous condenser operates in a similar way to large electric motors and generators. It contains a synchronous motor whose shaft is not directly connected to anything, but spins freely and is able to adjust technical conditions on the power system. Synchronous condensers are an important source of system strength and other services such as inertia."So the synchronous condensers should be able to provide at least some of the system strength and inertia currently provided by gas-fired generators.
With the synchronous condensers in place we might hope that renewable energy will be able again to produce substantially more than 80% of the state's electricity when there is sufficient wind.
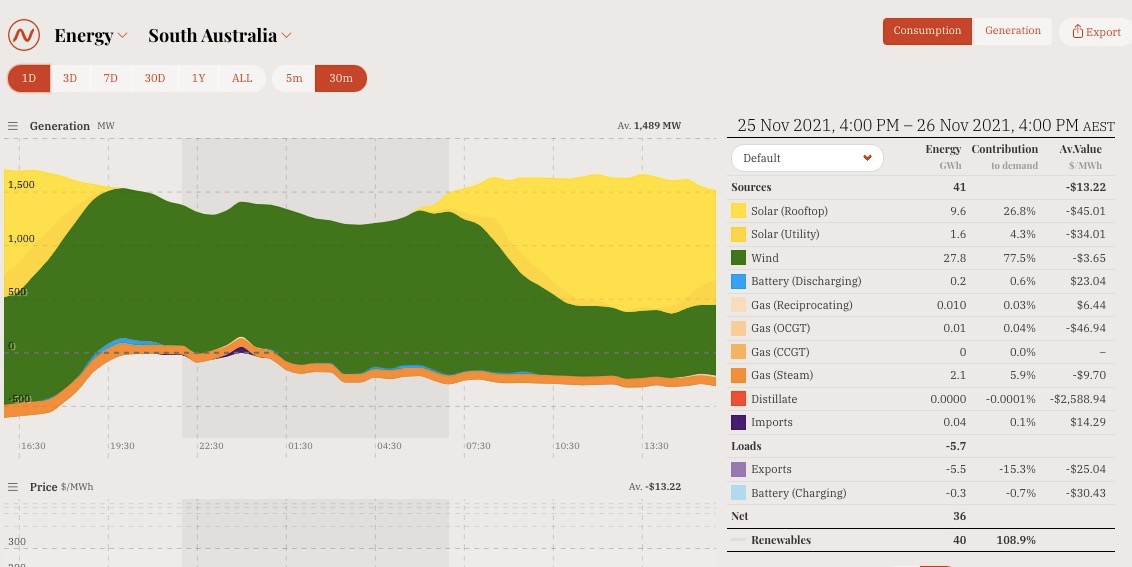
In November 2021, because of the stability provided to the grid by synchronous condensers and other actions, the minimum amount of gas-fired generation in the South Australian grid was reduced to about 6%.
|
|
|
| ||||
| ||||
|
The graph showed that 108% of South Australia’s demand was generated by renewables in the previous 24 hours - that was not out of the ordinary for the recent past. What was different was that there was only 6% gas in the mix!
AEMO (the Australian Energy Market Operator) had previously required a higher percentage of gas-fired electricity in the mix - for stability. The graph suggested that AEMO had accepted that the four Synchronous condensers and several batteries that had been installed provided a level of stability such that the amount of gas-fired power in the mix could safely be substantially reduced.
I had happened to record OpenNEM graphs on a few previous days of the same month. They showed that the proportion of gas was 20% back on 11th, 15% on the 18th and 11% on the 21st. Now it was down to 6%! It seemed that AEMO had gradually reduced the proportion of gas-fired electricity in the mix over the previous few weeks. It seems to being held at about 82MW at the present.
Another point needs to be made here. For the quantities of renewable electricity generation in the SA power grid to be what they are strongly suggests that more could be generated if there was a market for it. This makes the proposed SA-NSW interconnector and a hydrogen industry more needed than ever before, especially if the SA renewable energy base is to expand to its full potential.
|
|
|
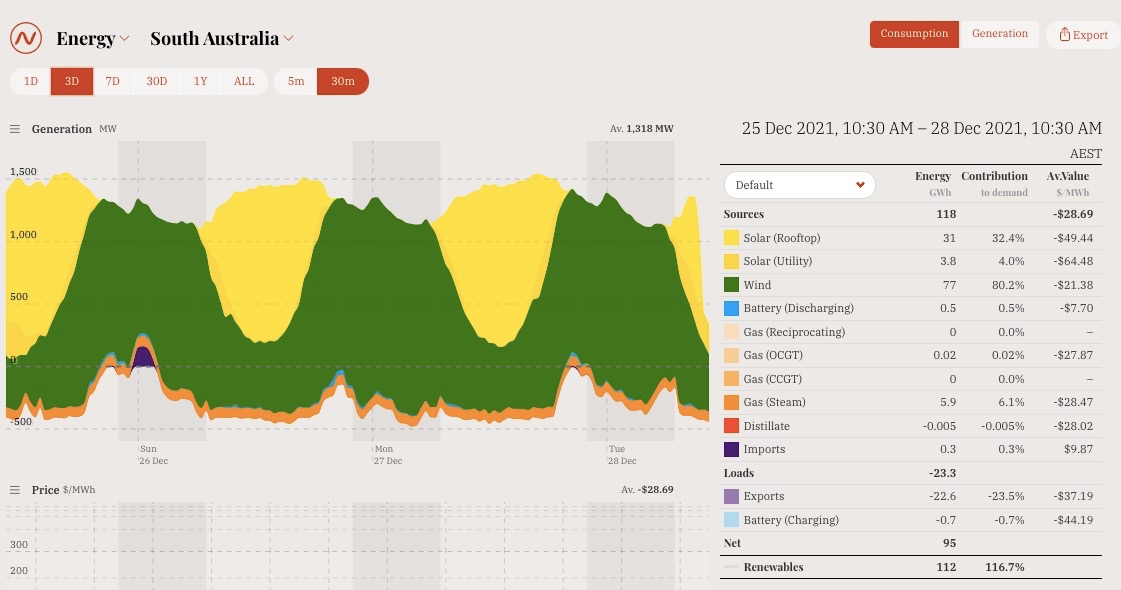
I just happened to look at OpenNEM at the time, so if I had the knowhow to pick and choose the exact time I downloaded the figures I would probably be able to find even more impressive figures.
The graphic shows 80.2% wind power, 32.4% solar rooftop, and 4.0% utility solar. Utility solar can supply around 8% of SA's power so it appears that in this period it was being significantly curtailed (that means that there could have been more renewable energy if it could have been used or exported).
Fossil fuels accounted for only 6.1% of SA's consumption. That was gas, SA has no coal-fired power generation.
|
|
Related pagesOn this siteEnergyAustralia's energy futureBase load power: the facts Electricity prices and renewable energy in Australia Glossary of technical terms relating to wind power How should Australia generate its electricity? Impressive renewable energy developments in Australia In-situ gasification of coal, the dirtiest energy on the planet? Mid-North South Australia, leading the nation in renewable energy Northern SA's renewables Power prices in Australia Pumped hydro energy storage South Australia's energy future Wind power in South Australia Wind power in Australia Environment, climate change, ethicsClimate changeClimate change, natural disasters and what we should be doing Major threatened disasters compared Greatest crime in history Opposition to wind power and to the coal industry The end of coal The Turnbull Australian Government |
Related pages: externalA Grid Dominated by Wind and Solar Is Possible - South Australia: A Window Into the Future. By Johanna Bowyer, Lead Research Analyst for Australian Electricity and Gabrielle Kuiper, DER Specialist and Guest Contributor for the Institute for Financial Analysis and Energy Economics (IEEFA), June 2021.7 renewable energy lessons from South Australia, by Sean Fleming for the World Economic Forum, June 2021. Against the odds, South Australia is a renewable energy powerhouse. How on Earth did they do it?, The Conversation, written by Michael McGreevy and Fran Baum, both of South Australia's Flinders University, February 2021. South Australia: World Leader in Renewables and Energy Market Transition, Australia Institute National Energy Emissions Audit, authored by Dr Hugh Saddler, August 2019. South Australia has become a renewable energy powerhouse. How did they do it?, by Michael McGreevy and Fran Baum, Flinders University, March 2021. South Australia records 100pc solar in world first by Angela MacDonald-Smith for the Australian Financial Review, October 2020. SA has also recorded periods when wind power was sufficient to power the whole state and it is not unusual for combined wind and solar to exceed demand. South Australia’s stunning renewable energy transition, and what comes next; Renew Economy, 2019/11/05, written by Giles Parkinson. In a 2019/09/19 Simon Holmes à Court wrote an article in the Canberra Times headlined "ACT upstages the federal government with low-cost carbon policy". It's a good run-down on the ACT's great success in aiming at, and already getting close to achieving, 100% net renewable energy (while the federal government dithers). Jay Weatherill talks about South Australia's journey to a renewable-energy future; Robert McLean's Podcast. Jay's speech corresponded very well with my memory of developments; it entirely lacked the lies heard from the likes of Abbott, Turnbull and Morrison. A ReachTel poll conducted for the Climate Council on 2018/01/29 showed that a majority of South Australians think that the rest of Australia should follow SA's lead and "switch to renewable energy and storage in the next 5 to 10 years". United Nations Office for Disaster Risk Reduction report: The human cost of weather-related disasters 1995-2015. Renew Economy; AGL ridicules Coalition request to keep Liddell [coal-fired power station] open extra 5 years. The Conversation; "Wind power: why is South Australia so successful?", John Boland, Professor of Environmental Mathematics, University of South Australia, 2012/09/25. The Conversation; "Why coal-fired power stations need to shut on health grounds", David Shearman, 2016/11/28. The Uninhabitable Earth, Annotated Edition: "The facts, research, and science behind the climate-change article that explored our planet’s worst-case scenarios", by David Wallace-Wells, New York Magazine. The big three Australian power generators see no future in coalAGL's statement on the Liddell closure.Energy Australia boss says there are much better options than keeping the old Liddell coal-fired power station running for a few more years. Origin Energy boss rejects coal |
