The book published with the programs
Groundwater Discharge Tests: Simulation and Analysis |
|---|
|
The book was published in 1988. It included the source code (PASCAL) and notes about the programs |
|
|
|
This Web page, and its companion, Aquifer and well test analysis and simulation: Notes are a bit of nostalgia for me. Both pages would probably have been written about 2002. These few background notes were added in February of 2023.
|
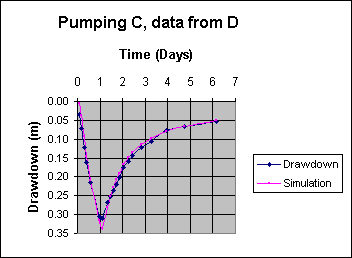
| A simulation fitted to drawdown and recovery in an aquifer test. (Well C was being pumped, the aquifer test data were recorded in piezometer D.) The CG programs can handle many stages in well or aquifer tests; variations in pumping rates including a zero rate (recovery). |
|
Home Notes on the CG programs Index |
|
|
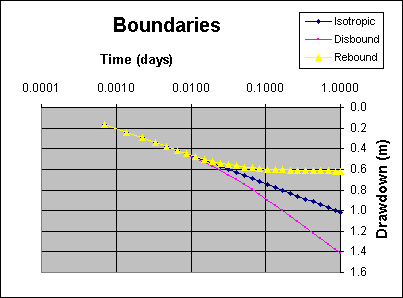
Simulated data from a steady-rate well discharge test. The blue (Isotropic) curve is the simple case with no boundaries. The purple (Discharge) curve is for a simple discharge (water-tight) boundary. The yellow (Recharge) curve is for a simple recharge (constant-head) boundary. |
The data for all the graphs (charts) on this page were:
The graphs on this page are examples of uses to which the programs can be put; they are not neccessarily conected with the adjacent text.
|
Home Top Notes on the CG programs Index |
|
|
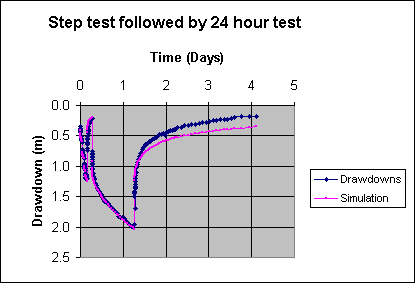
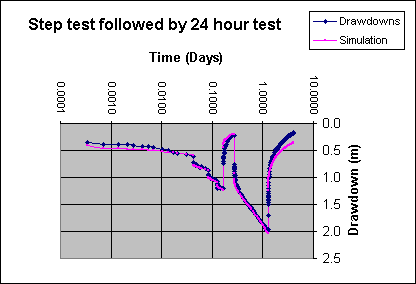
A data fit produced by CG. Here the well discharge test
included a stepped rate test, followed by a period of
recovery, followed by a one-day steady-rate test, followed by
recovery. The CG programs can analyze a data set like this as easily as for a simple, single-rate test. The displacement between the final recovery and simulated recovery is most likely due to entrapped air in the fractured rock aquifer. |
|
| Here the data of the preceding graph are plotted against the logarithm of time. |
|
Home Top Notes on the CG programs Index |
|
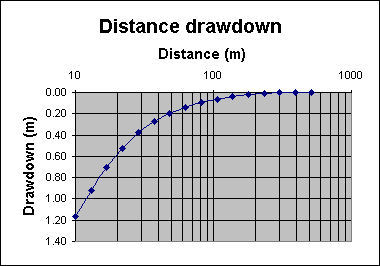
| This distance drawdown graph has been produced by the stand-alone program CGSim.exe. It is based on a semi-bounded strip aquifer with T=38 inside the strip and T outside the strip (T2) equal to 260. S=0.005 and the strip width is 30m. All units here are based on metres and days. |
Notes on CGSim
Purpose
To produce type curves:
|
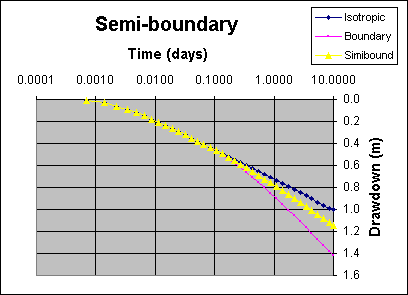
| A comparison between no boundary (isotropic), a simple discharge boundary and a semi-boundary. In all cases the boundary is 600m from both discharging well and piezometer. In the 'semibound' case transmissivity on the near side of the boundary is twice that beyond the boundary. |
Instructions for use
You should have the files CGSim.EXE, CGSimIn.TXT, CGSim.ICO,
CGSim.DOC and EGAVGA.BGI, all in the same subdirectory.
You can modify the configuration file CGSimIn.txt with any text editor (eg. Notepad, Dos Edit.com) or word processor to set up initial conditions. Take care to retain the format of the file (retain a copy of the original in-case of mistakes). Read the notes in this file. Note that the configuration file can arrange for reading a .CTD data file, as in the demonstration.
To run the program from Windows Double click on CGSim.exe in Windows Explorer. (CGSim can be run from DOS or Windows.)
Once the program is running use the left and right arrow keys to highlight
the parameter that you want to adjust. Use the up and down arrow keys
to adjust the highlighted parameter.
|
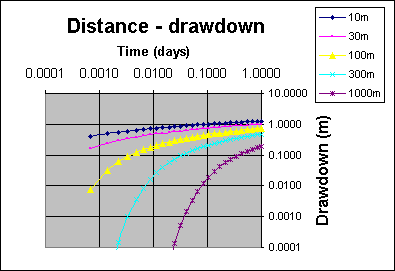
| A group of aquifer test simulations for changing values of distance between pumped well and piezometer. This is for the very simple case of a Theis (confined, isotropic) aquifer, it would be just as easy to produce a nest of type curves for many combinations of aquifer type and boundary configuration. |
|
Home Top Notes on the CG programs Index |
|
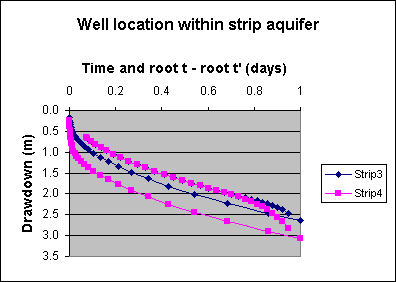
| An aquifer test simulation showing the slight differences to be expected depending on the location of pumped well and piezometer within a strip aquifer. |
The example data file, CLRPU1DD.CTD, fits well with a strip aquifer
with T=1160, S=0.0039, and strip width=365m. As it's set up, the .CFG
file starts the program using the Theis solution, change to the strip
solution to get a good fit. Then experiment.
|
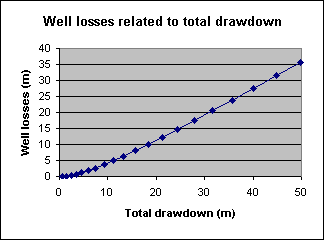
| One of the minor functions of the CG programs. This sort of graph can be produced from what I've called a 'well characteristics file'. It compares well losses to total drawdown for a series of increasing discharge rates in a particular well. |
|
Home Top Notes on the CG programs Index |
|
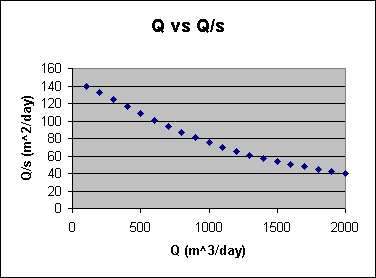
| Another example of a graph produced from a 'well characteristics file': discharge rate (Q) plotted against specific capacity (Q/s). |
|
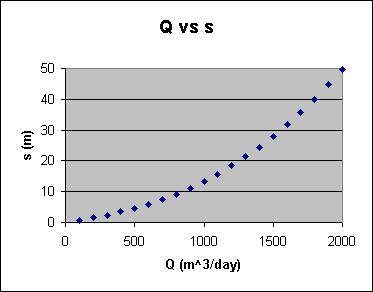
| Another example of a graph produced from a 'well characteristics file': discharge rate plotted against drawdown (s). |
|
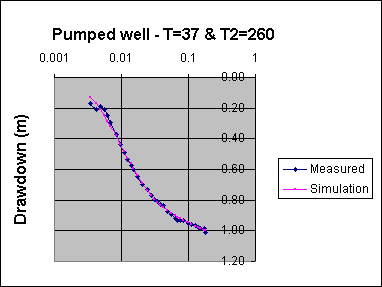
| An example of a semibounded strip simulation fitted to data from an actual well test. (As the data were from a pumped well a bit of data manipulation was required.) |
|
Home Top Notes on the CG programs Index |
|
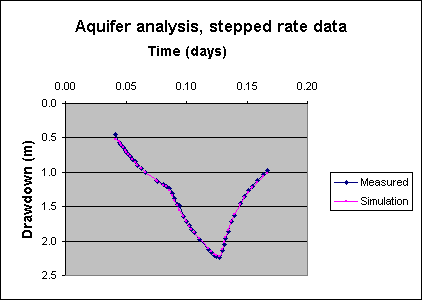
| An aquifer test analysis based on water levels recorded in a piezometer during a stepped rate discharge test. |
|
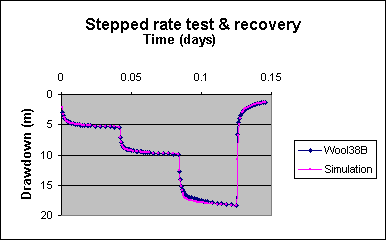
| A simulation and field data after evaluation of the well equation. |
|
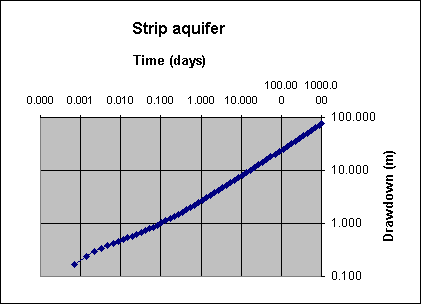
| A simulation demonstrating how a time-drawdown data falls on a straight line on a log-log graph after boundary effects have come fully into play. |
|
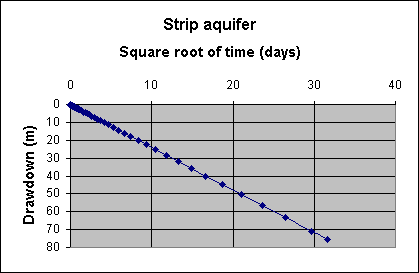
| The same drawdown data as in the above graph, but here plotted against the square root of time. |
|
Home Top Notes on the CG programs Index |
|
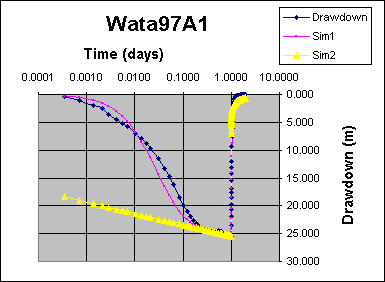
| The CG programs can simulate well storage effects while evaluating the well equation in a well test. This graph shows a simulation based on the evaluated well equation with and without well storage effects, compared to the recorded data. |
|
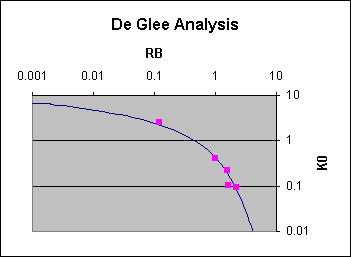
| Best fit DeGlee analysis for well Waik6. T=27m2/day, L=334m. |
|
Home Top Notes on the CG programs |