Wind Power Cost: the facts

Electricity generated by wind turbines has in the past been more expensive than electricity generated by more conventional means. This has steadily changed over the past decades and now wind power is providing some of the cheapest available energy.

This page has been written in Australia from an Australian perspective but will have a much wider relevance.

Before March 2018 my notes concerning the cost of wind power have mainly been on my general wind power page, but ignorance and misinformation on the subject has been common enough to justify a special page.


This page was started as a separate page on 2018/03/29, last edited 2023/07/23
Contact: David K. Clarke – ©


Introduction

 
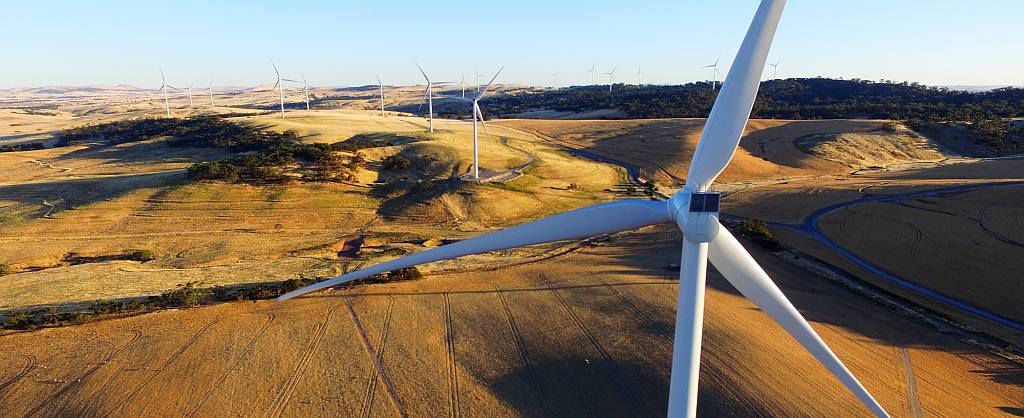
A South Australian wind farm
Wind farm
Wind farms like this, together with solar power, are gradually replacing fossil fuelled power stations
Utility-scale wind power in Australia was almost non-existent before the beginning of the twenty-first century. At the turn of the century there were only 30 megawatts (MW) of installed wind power capacity in the whole country and three-quarters of that had been build in the last year of the old century. At the time I created this page, March 2018, there was over 4,700 MW in Australia (see chronology of wind farm construction in Australia). A further 2,952 MW was under construction. The main reason for this phenomenal growth was the decline in the cost of the technology.

In 2018 on-shore wind power and utility-scale solar photo-voltaic power were the cheapest options for new-build energy generation.

It is important to discriminate between wholesale electricity prices (the prices that the generators receive) and retail electricity prices (the prices that the consumers pay). Wholesale prices are typically a fraction of retail prices and, at least in Australia, the former have tended to fall in recent years while the latter have increased, due to increased charges for transmission and distribution and rising gas prices.

Gas generators get high average prices because they are available on demand, but the fact remains that the wholesale cost of gas-fired electricity generation has been well over twice that of wind power!

It was the high prices given to power that was available on demand, compared to power available all the time (base-load) or intermittently (wind and solar photo-voltaic), that was making utility-scale batteries a very economically attractive proposition in early 2018. At the time of writing the biggest battery in the world at Hornsdale Wind Farm in South Australia had proven so successful that a number of other utility-scale batteries were either proposed or under construction. Solar thermal power with energy storage had become very attractive for similar reasons.


Cost data

The cost data below has been collected from many credible sources. It is important to consider the dates at which it was collected because of the steeply declining cost of wind power.

 
This section updated
2023/07/22

Cost of electricity


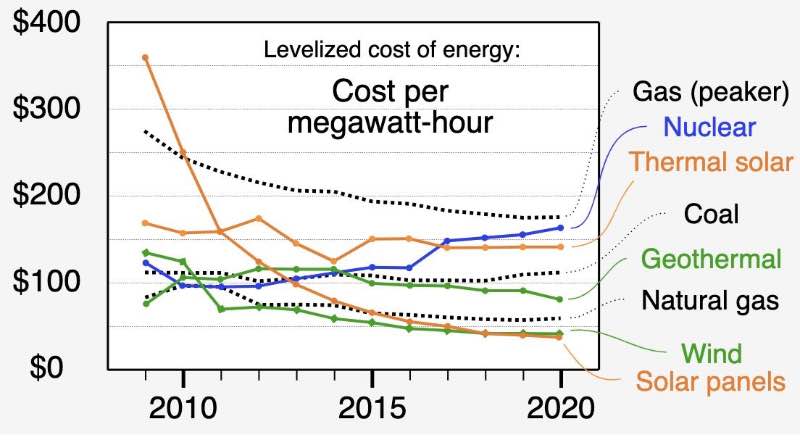
Levelised cost of energy
From Wikipedia, Levelised cost of electricity, downloaded 2023/07/22
The graph on the right was copied from Wikipedia article Levelised cost of electricity on 2023/07/22. Wikipedia gave the data source as Lazard.

Quoting from that article:

"The levelized cost of electricity (LCOE) is a measure of the average net present cost of electricity generation for a generator over its lifetime."

In relevance to this page the graph shows two things:

  1. The cost of wind power has significantly decreased over the period 2009 to 2020;
  2. Wind and solar PV power were the cheapest forms of power generation in 2020.
Another page on this site deals with the costs of electricity from renewable sources: wind and solar.


This section added
2022/01/19
As of the time of writing this small section IRENA (International Renewable Energy Agency) has a site publishing global trends in the costs of renewable energy. I have tabled some of the data from the IRENA page (as of 2022/01/19) below. LCOE is levelized cost of energy.

Total installed costs
Renewable energy type
2010
2020
Onshore wind
$1,971/kW
$1,355/kW
Offshore wind
$4,706/kW
$3,185/kW
Solar photovoltaic
$4,731/kW
$883/kW
Concentrating solar power
$9,095/kW
$4,581/kW
  
Average LCOE
Renewable energy type
2010
2020
Onshore wind
$0.089/kWh
$0.039/kWh
Offshore wind
$0.162/kWh
$0.084/kWh
Solar photovoltaic
$0.381/kWh
$0.057/kWh
Concentrating solar power
$0.340/kWh
$0.108/kWh
In order to give an idea of the rate of decrease in costs I have given costs for the earliest and most recent dates shown on the IRENA graphs. All costs are in US dollars.

Note that this is the figures for LCOE in the table are the costs of generating the electricity, they do not include the cost of delivering the power to consumers.


This section added
2019/07/16

Study published in The Conversation says wind and solar cut wholesale power prices

A study done by Zsuzsanna Csereklyei of the Royal Melbourne Institute of Technology and others and published in summary on 2019/07/16 in The Conversation stated that:
"Colleagues Songze Qu and Tihomir Ancev from the University of Sydney and I have examined the contribution of each type of generator to wholesale prices, half hour by half hour over the eight years between November 1, 2010 and June 30, 2018.

We find that, rather than pushing prices up, each extra gigawatt of dispatched wind generation cuts the wholesale electricity price by about A$11 per megawatt hour at the time of generation, while each extra gigawatt of utility-scale solar cuts it A$14 per megawatt hour."
Ms Csereklyei went on to explain how this conclusion was reached.

On the impact of gas prices on the wholesale cost of electricity Ms Csereklyei wrote:

"We find the price of natural gas has a strong positive effect on wholesale electricity prices. An increase of A$1 per gigajoule in the natural gas price pushes up wholesale electricity prices by about A$5 per megawatt hour."


Wholesale prices paid on the Australian National Electricity Market (NEM)

 
This section
added 2019/02/05
Updated 2022/02/11
The prices below were the "average values" of power on the Australian NEM over two periods, the first 2018/02/12 to 2019/02/10, the second the whole of 2021, as reported on OpenNEM for each region. I have placed the different generation types in the same order that they appear in OpenNEM. All values are Australian dollars per megawatt-hour ($/MWh) rounded to the nearest whole dollar.

$92/MWh equals 9.2¢/kWh. The price of electricity to household consumers in Australia is typically around 28¢/kWh; the extra cost comes from transmission, distribution and retailing.

Western Australia is not on the NEM, it has a separate power grid.

Average wholesale values over the period 2018/02/12 to 2019/02/10, Aus$/MWh
RegionAverageSolar (rooftop)Solar (Utility)Wind HydroBatteryGas (Recip.) Gas (OCGT)Gas (CCGT)Gas (Steam) DistillateBiomassBlack Coal Brown Coal
All Regions929097 8399193 7618999 1691,60881 8498
NSW928890 84110   144110  241  89 
Queensland927480 8078  7612081  13081 78 
SA134108144 81 168  247122 1582,765    
Tasmania9488  7074   13376       
Victoria118111166 87188663  222  218   98

Note that it is the price of gas power that causes the high average price in SA. The price paid for wind power is well below the average. (Distillate makes up a very small part of the total generation.)


Average wholesale values over the whole of 2021, Aus$/MWh
RegionSolar (rooftop)Solar (Utility)WindHydroBattery Gas (Recip.) Gas (OCGT)Gas (CCGT)Gas (Steam) DistillateBiomassBiogasBlack Coal Brown Coal
All Regions275548 82135 123145 113112690 1115094 52
NSW415470 162   291 144 684    85 
Queensland387391 210151 71396 156 605 111 108  
SA34243  154 165232 87 1081,383     
Tasmania29 30 40    96-- -     
Victoria152535 9985  155  134      52
WA333744     62 58 56  50 57 

Abbreviations used in the tables:

  • Recip. – Reciprocating
  • OCGT – Open cycle gas turbine
  • CCGT – Closed cycle gas turbine

The above, as I understand it, were the average wholesale prices paid for power on the open market. It is notable that:

  • Over the first period (and table) the prices paid for wind power were below the average in each jurisdiction and were close to being the lowest price paid in each jurisdiction;
  • And in the second period (and table) while wind was cheaper than all fossil fuelled power generators, solar was cheaper again;
  • Again in the second period, Queensland has the highest value for wind power, it also has the lowest percentage of wind power of any state (not shown in the table). NSW has the second highest value for wind power and the second lowest percentage of wind power. It seems that a high percentage of wind power forces prices down.

See below for several recent contract price agreements on wind power in Australia.


Several recent price agreements in Australia

 
Updated 2020/09/09
  • In 2014 the ACT Government signed contracts to buy wind power from several new wind farms:
    • For Aus$87/MWh from Ararat Wind Farm Pty Ltd;
    • For Aus$81.50/MWh from Coonooer Bridge Wind Farm Pty Ltd;
    • For Aus$92/MWh from HWF1 (Hornsdale Wind Farm Stage 1, owned by Neoen) Pty Ltd.
  • In September 2015 AGL sold a 50% stake in Australia's biggest wind farm, Macarthur, and at the same time signed an agreement with the new owners to buy power at Aus$79/MWh (US$57).
  •  
    The prices highlighted in bold on the left were each record low prices at the time of the contracts; showing how the price of wind power was continuing to fall.

    $81.50 in 2014 to $60 in mid 2017 is a 26% decrease.

    In the third ACT renewable energy reverse auction (second for wind power) late in 2015:
    • For Aus$89.10/MWh from Sapphire Wind Farm 1 Operations Pty Ltd;
    • For Aus$77/MWh from Hornsdale Wind Farm 2 Pty Ltd.
  • In the forth ACT renewable energy reverse auction in mid 2016:
    • Crookwell Wind Farm Stage 2 in NSW was contracted for 91MW at Aus$86.6/MWh;
    • Hornsdale was contracted for a further 109MW at Aus$73/MWh (Stage 3).
  • AGL will pay Aus$65/MWh for the output of Silverton Wind Farm, see RenewEconomy, 2017/01/19, for more information. (That was equal to US$49 at the time.)
  • Origin Energy agreed to a long-term power purchase agreement at below Aus$60/MWh for power generated by the proposed Stockyard Hill Wind Farm; May, 2017. RenewEconomy reported that the price was well below $60 and "closer to $50 than $60".
  • AGL contracted with PARF to buy the electricity from Coopers Gap Wind Farm for five years for 'less than $60/MWh' in August 2017.
  • Renew Economy reported on 2020/09/08 that Neoen arranged a 14-year agreement to sell power from its proposed Goyder South Renewables Zone development in South Australia to the ACT government for $44.97/MWh.

Snowy Hydro 'firmed' renewable energy wholesale price

A piece published in The Age, 2018/11/02, written by Cole Latimer, discussed an arrangement that the fully Australian government owned Snowy Hydro had put together to provide 'firmed' renewable electricity for "below $70 a megawatt hour from the start of 2020". Mr Latimer stated that "Electricity is currently being traded on the ASX energy market for the first quarter of 2020 at $98.5 a megawatt hour in NSW and $108 per megawatt hour in Victoria."

The 'firming', as I understand it, would involve Snowy Hydro buying power as it became available from a number of wind and solar farms and reselling it as required under contract, topped-up as needed with hydro-power.

Electricity prices in US wind power states decreased while prices in other states increased

On 2014/05/05 David Ward for the American Wind Energy Association reported
"states that obtain more than 7 percent of their electricity from wind saw an average electricity price decrease of 1.31 percent over the time period the groups looked at, while the nation saw an average electricity price increase of 3 percent."


Cause or effect?

Are high rates of wind farm construction due to high power prices or do high levels of wind power impact power prices?


The Australian situation

South Australia has some of the highest electricity prices in Australia, it also has the highest penetration of wind power.

Apart from the wind power and solar PV, most of SA's power is generated by burning expensive gas; two old coal-fired power stations were shut down in 2016 because they were economically uncompetitive.

Wind power is attractive in SA because of the high price of electricity. The four other mainland states have cheap (and highly polluting) coal and the remaining state, Tasmania, has plentiful hydro-power.

In a few parts of the world there is some correlation between high electricity prices and high wind power penetration. (Probably Australia and the USA, apparently not in Europe. Very significantly China and India, two countries that are installing huge amounts of wind power, have very low electricity prices.)

Wind farm opponents are quick to claim that the wind farms have caused the high electricity prices in those places where a correlation exists, but it could just as easily be the other way around.

If you wanted to build any sort of power station and you had a choice of where to build it, you would, of course, go somewhere you were going to get a high price for the electricity you generated. You would look for places with high electricity prices. So it could well be that the high electricity prices attract wind farms, rather than the wind farms causing the high prices.


As early as 2014 wind power was Denmark's cheapest energy

On 2014/07/22, Ray Weaver reported in the Copenhagen Post that:
"Onshore wind power is the cheapest form of new electricity generation in Denmark, according to a recent study by the Danish Energy Agency (DEA), the government's energy research body. An analysis made public on Friday showed that new onshore wind plants due to come online in 2016 will cost ... far less [per kWh] than coal, biomass and other forms of energy production.
The price of wind power continued to drop after 2014.


True cost of coal

 
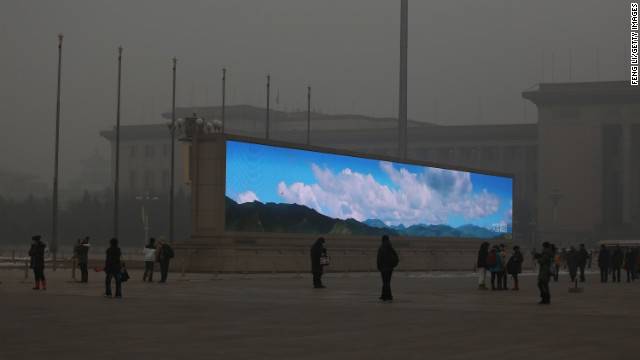
A big screen reminds people in Beijing of what a blue sky looks like
Beijing smog
Air pollution purchased from Australia
Image source: FengLi/Getty Images
The World Health Organisation has estimated that air pollution kills around seven million people each year and much of this comes from the burning off coal.

To this must be added the incalculable cost of climate change and ocean acidification, both of which are largely due to the burning of fossil fuels.

Climate Progress published an article that discussed the true cost of coal when the economic, health and environmental costs are all taken into account (no longer available on the Internet?). The original research was published in the Annals of the New York Academy of Sciences by Dr. Paul Epstein. It was calculated that if the true costs of coal was considered the price of electricity from coal fired power stations would rise by about 18 cents per kilowatt-hour (or $180/MWh).


Historical interest
The material below was written some years ago and is left for reference


Impact of Operational Wind Generation on the National Electricity Market

By P. Wild, W.P. Bell, J. Foster; School of Economics, Uni. Qld. (Download pdf) Modelling showed:
"The stand-out states are South Australia and Victoria which experience [wholesale electricity price] reductions of between 24.9 and 38.9 per cent and 14.5 to 21.6 per cent over the interval 2010-2012."
"The impact of wind generation in the NEM was to reduce carbon emissions in all states. The stand-out state was South Australia with percentage reductions in carbon emissions in the range of 3.6 to 11.0 per cent."
 

RenewEconomy

reported in 2013/02/07 "that new wind farms could supply electricity at a cost of $80/MWh – compared with $143/MWh for new build coal, and $116/MWh for new build gas-fired generation."
Renewably generated electricity has been more expensive than fossil-fuel fired electrical generation (unless the environmental costs of burning fossil fuels is taken into account), but this is changing. In mid 2012 it seems that the cost of wind and solar photovoltaic is becoming competative to new coal, gas and nuclear. The costs of solar PV power has fallen more quickly than utility scale wind power.

In 2013 wholesale power prices have fallen to quite low levels, partly due to reduced power consumption.

In February 2013 Bloomberg New Energy Finance reported on a study that showed that some renewables had become cheaper than fossil fuels in Australia.

"The study shows that electricity can be supplied from a new wind farm at a cost of AUD 80/MWh (USD 83), compared to AUD 143/MWh from a new coal plant or AUD 116/MWh from a new baseload gas plant, including the cost of emissions under the Gillard government's carbon pricing scheme. However even without a carbon price (the most efficient way to reduce economy-wide emissions) wind energy is 14% cheaper than new coal and 18% cheaper than new gas."


Capital costs of wind power
These figures are out of date; this section is left here for possible historic interest only.

 
Capital cost per Watt
Wind farmPer installed WattPer generated Watt
Brown Hill Range$2.46$6.23
Bungendore WF$1.56$5.95
Canunda$2.01$6.68
Challicum Hill$1.45$5.11
Clements Gap$2.38$7.02
Cullerin$1.67$4.01
Lake Bonney #2$2.52$11.05
Snowtown$2.22$5.64
Starfish Hill$1.86$6.88
Wattle Point$2.47$7.54
Waubra$1.70$4.65
Average$2.03$6.43
The figure used for the capital cost of Wattle Point Wind
Farm was the reported sale price of $225m in 2007.
The cost of building wind farms is often stated by the organisations that build them – the total costs of the farms I've listed in the table on the right are given in the sections on the relevant farms.

In the table I give the capital costs per Watt, as well as I can calculate them, for several wind farms. Please note that the table gives the cost of building a wind farm divided by the maximum number of Watts that wind farm is capable of generating (cost per installed Watt) and the number of Watts it has generated on average (cost per generated Watt). The prices per generated Watt are from the capacity factors that I calculated in January 2011.

In dollar terms, the cost of building wind farms has increased in the last few years, at least partly due to substantial increases in the price of steel. Against this is a longer-term trend for the cost of wind turbines, per MW, to decrease. Factors such as these cause variations in the capital costs of wind farms with time. At least some of the variation in the costs per installed Watt would be due to the time of construction; a significant factor in the cost per generated Watt is the capacity factor achieved by the farm.

Unlike fossil-fuelled, or nuclear, power stations, once the wind farm is built there are, of course, no further costs for fuel; the capital cost is by far the greatest cost of wind power.

Cost of solar PV declining

Climate Spectator carried an article on declining prices of solar PV, 2012/05/17, (relating to a paper published on Bloomberg New Energy Finance). The report suggested that "fully installed system cost of $3.01/Watt for 2012 and $2.00/Watt for 2015" and that the cost of power generated by solar PV was now below residential grid-price parity in a number of countries including Australia.


Related pages

On this site...

Wind power

Wind power in Australia

A glossary of terms relating to wind power

Wind power in South Australia

South Australia's huge success with adopting renewable energy

Wind power problems, alleged problems and objections
  Subsidies, in relation to wind power

Renewable energy

Electricity prices and renewable energy in Australia

Non-renewable energy

Fossil fuels

End of Coal: the coal industry is facing a terminal decline
Killer Coal: air pollution from coal burning kills millions of people world-wide each year

Nuclear

Nuclear
  Part-built nuclear power stations abandoned because of cost over-runs


Related external pages...

A number of references are scattered through the text of this page.

ARENA; Comparison of Dispatchable Renewable Electricity Options, June 2017. "The report finds that the Levelised Cost of Electricity (LCOE) of variable renewable energy (VRE) technologies was about $65 per megawatt-hour (MWh) in 2017. The report estimates the LCOE of dispatchable renewable technologies to be $90-140/MWh for technologies used daily."

Lazard's Levelized Cost of Energy 2017

Wikipedia: Cost of electricity by source; wind power

Report from IRENA; the International Renewable Energy Agency, 2017

Snowy says cost of “firm” wind and solar significantly below current base-load prices"; Giles Parkinson, RenewEconomy, 2018/10/23.

The federal government owned utility Snowy Hydro says it will expand the scope of its wind and solar tender after confirming that “firm renewables” can deliver prices “significantly” below current “base-load”, or wholesale, prices.

The Conversation

A study done by Zsuzsanna Csereklyei of the Royal Melbourne Institute of Technology and others and published in summary on 2019/07/16 says wind and solar cut wholesale power prices.

The verdict is in: renewables reduce energy prices (yes, even in South Australia), The Conversation, 2018/12/06, written by Bruce Mountain and Dr Steven Percy, both of the Victoria University.

Solar PV and wind are on track to replace all coal, oil and gas within two decades

FactCheck Q&A: are South Australia’s high electricity prices ‘the consequence’ of renewable energy policy? The verdict was 'no'.