| |
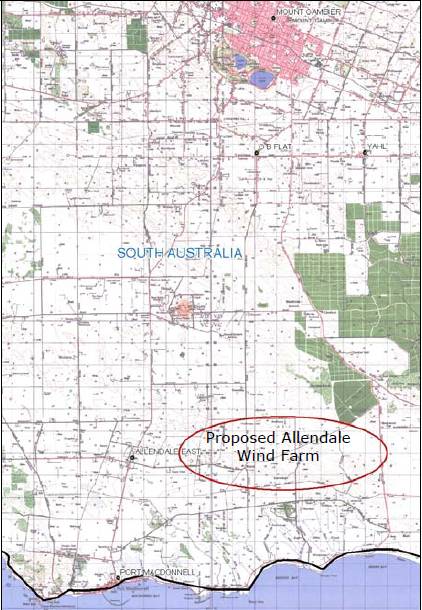
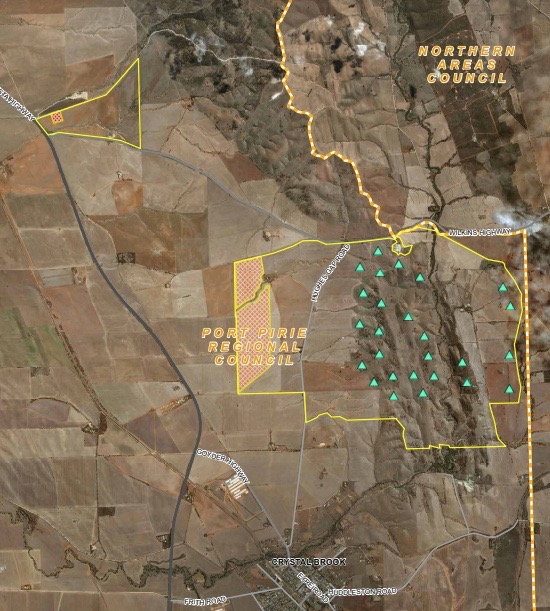
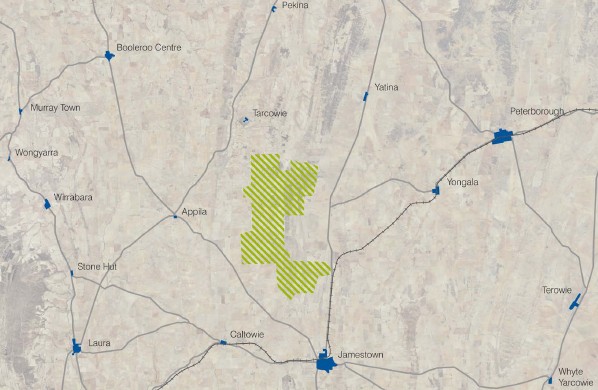
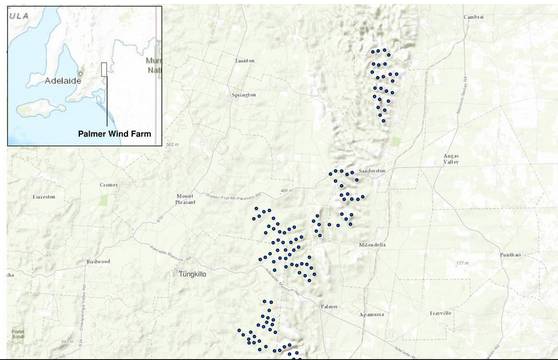
| Location of the proposed project
|
|---|
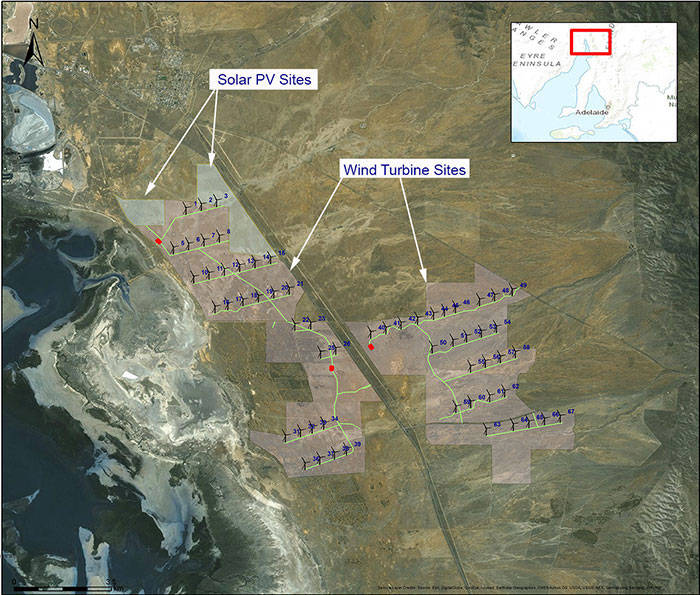
| | Image credit DP Energy Australia
| |
Update January 2020
It has been reported that construction is to start in June 2020.
|
This project has been proposed by DP Energy Australia (DPEA), who have a
Net page on the project.
DPEA state that they have lodged a Development Application with the SA
Department of State Development (apparently in early December 2015).
It received approval from the state government in August 2016.
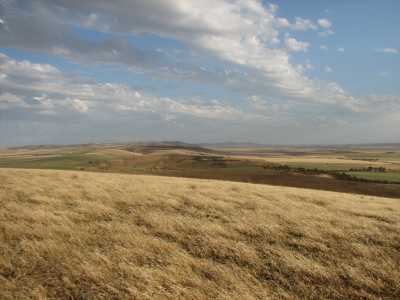
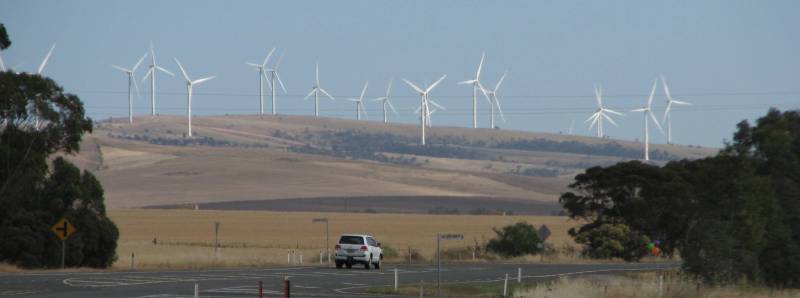
The map at the right shows that the wind farm will be on both sides of the
Port Augusta to Port Pirie highway (from upper left to lower centre of the
map).
Upper Spencer Gulf is on the left and the lower slopes of the Flinders Range
can just be seen on the right of the map.
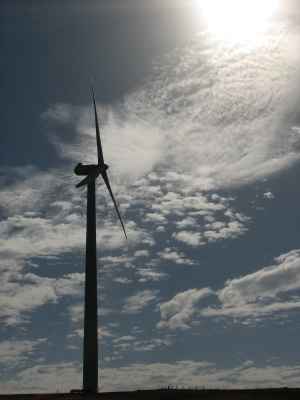
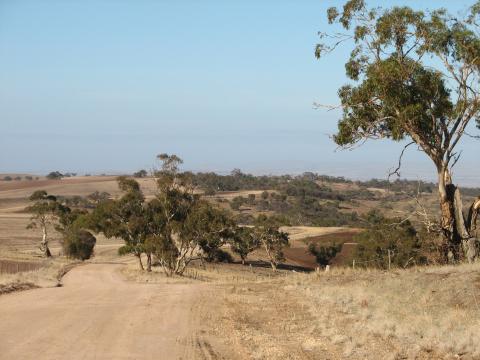
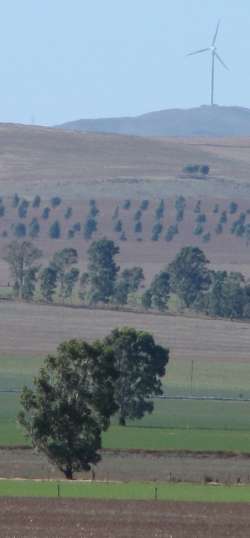
On 2015/12/04 the DPEA
Home Page included a
photo taken near Wilpena, about 130km from the proposed wind farm.
The solar PV array has been proposed to cover 400 hectares.
The total capacity of the Port Augusta Renewable Energy Park (PAEP) has been given as 375MW.
DP Energy estimate that the completed energy park will generate about 1000 GWh of clean energy each year, saving 470 thousand tonnes of greenhouse carbon dioxide emissions.
In mid December it was reported in The Transcontinental (Port Augusta) that
"DP Energy is set to lodge a development application for Stage 2 of the
$600million Port Augusta Renewable Energy Park."
"The second stage adds additional solar capacity, as well as battery storage
capacity of 300 MW and 400 MW [MWh?] to the energy park, while also
providing the option for synchronous condensers."
My own opinion
I would not like to see wind turbines between the main road and the Flinders
Range.
This is one of the few wind farms that I'd prefer was not built; or at least
the part between the road and the range.
There are some views and areas that should be 'sacred'.
Summary data for Port Augusta Renewable Energy Park Stage 1 wind farm
| Status | No. of turbines | MW each | Total MW
| Construction due | Lat | Long
|
|---|
| Approved | 50 | 4.2 | 210? | June 2020
| Approx. S 32.592° | E 137.891°
|
| |
|
This section written 2010/01/14
|
|
(Wind farm name uncertain)
This proposed wind farm is interesting for it's large size and the fact that
the proposal came from a group of 30 farmers who recognised the potential on
their land.
Michael McCourt, of Beachport, is heading the project on behalf of the
farmers.
The agreement by Macquarie Capital Group Ltd. to take "responsibility for
all of the ongoing development activities for the proposed wind farm"
(reported in Border Watch, 2009/12/22) is very significant because it
indicates that financial backing has been obtained; always a hugely
important mile-stone for any wind farm development.
Summary data for Robe Wind Farm
| Status | No. of turbines | MW each | Total MW
| Completion due | Lat | Long
|
|---|
| Proposed | ? | ? | 600 | Undecided
| Approx. S 37.11° | E 139.80°
|
The wind farm is to be built on the Woakwine Range between Beachport and
Mount Benson.
Beachport is 78 km NW of Mount Gambier, Mount Benson is about
60 km NNW of Beachport.
I suspect that substantial upgrading of the power transmission system
will be needed before the project can proceed.
| Status | No. of turbines | MW each | Total MW
| Completion due | Lat | Long
|
|---|
| Abandoned | 30 to 35 | 3? | 90 to 105? | -
| Approx. 33.99° | 139.10°
|
| |
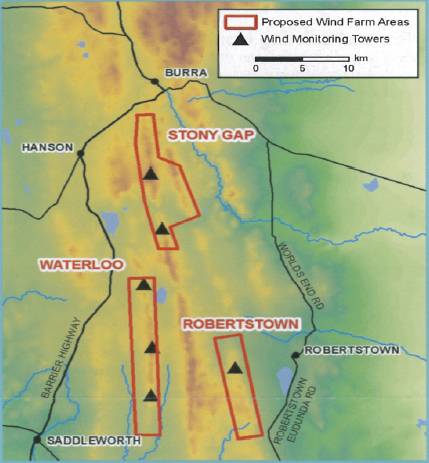
| Robertstown, Stony Gap, and Waterloo Wind Farm locations
|
| |
Image from Roaring 40s
| |
Energy Australia decided that a wind farm on this site would be unviable,
and announced that on 2014/04/14.
Several reasons have been given by EA and others. I will not speculate.
Robertstown is 50 km
ESE of Clare, 21 km north of
Eudunda, and 110 km NNE of Adelaide; the wind farm is about 6 km
west of the Robertstown township.
The proponent was originally Tasmania-based Roaring 40s, but when this was
disbanded it was transferred to Energy Australia.
It was earlier reported that this and
Stony Gap Wind Farm were to be extensions
of Waterloo Wind Farm, but in fact
Energy Australia are treating all three as separate projects.
In early 2012 Energy Australia, under its older name, TRUenergy, released a
locally conducted opinion survey
concerning its existing and proposed Mid-North wind farms.
More detail under
links.
Community Liaison Group
Energy Australia have established a Community Liaison Group concerning its
three Mid-North wind farms.
The group meets every
second month and brings together many interested local people
with TRUenergy staff and experts in various fields relevant to wind power.
(I, David Clarke, the author of these pages, am a member of the group.)
This section discusses Snowtown Stage 1.
Stage 2 is discussed below.
As of mid 2018 the two stages combined were generating more power than any other wind farm in Australia.
This wind farm is on the top of the north-south trending Barunga Range west
and north-west of Snowtown and about 150 km north of Adelaide.
The closest turbines are around seven kilometres from the town.
For directions to Snowtown go to
ExplorOz.
So far as I know, there has never been any local opposition to this project,
and as mentioned below, the people of Snowtown and district seem very happy
with their local wind farm.
(I live fifty kilometres away.)
A company named Wind Prospect
originally proposed up to 105 wind turbines each of 2 MW.
When the first stage was built there were 47 turbines, a prototype
S95 was added in July 2011.
A major extension was built from 2012 to 2014 increasing the total
installed capacity to 370.8MW; see
Snowtown Stage 2.
Snowtown Stage 1 summary data
| Status | No. of turbines | Manufacturer | Model | MW each
| Total MW | First power
to grid | Completed | Capacity factor
| Lat | Long
|
|---|
| Operating | 48 | Suzlon | S88
| 2.1 | 100.8 | March 2008 | Early September 2008
| 41% | S 33.75° | E 138.13°
|
| The S95 turbine added in July 2011 increased
the installed capacity from 98.7 MW.
|
The capacity factor was calculated from AEMO data from July 2009 to
December 2012 inclusive, is the best I have calculated for any Australian
wind farm (as of December 2012) and is very good by world standards.
It takes into account the 48th turbine added in July 2011.
(The average capacity factor for south-eastern Australian wind farms is about 35%.)
Following construction of Snowtown 2, the capacity factor of Snowtown 1 fell
to around 39% (figures from AEMO's SA Renewable Energy Report for 2016).
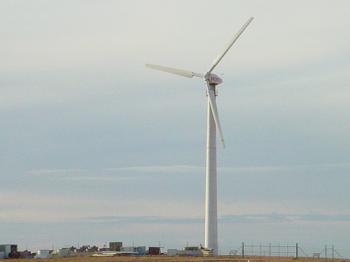
|
|
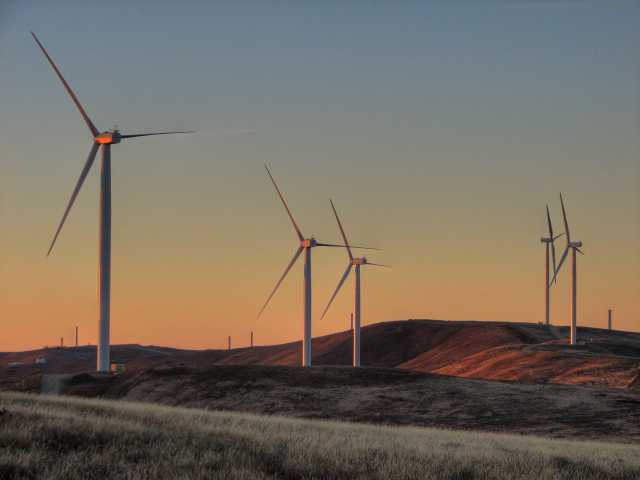
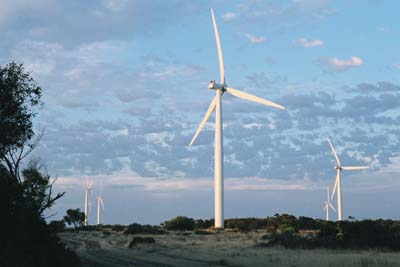
The first turbine of the Snowtown Wind Farm
2007/12/28
|
Additional data on Snowtown Wind Farm
| Owner | Trust Power Ltd.
|
|---|
| Operator | Suzlon
|
|---|
| Project cost | Aust$220 million
|
|---|
| Expected output | 350 GWh/yr
|
|---|
| Greenhouse gas savings | 345 000t/yr
|
|---|
| Turbine type | 47 Suzlon S88-2.1 MW
1 Suzlon S95-2.1 MW
|
|---|
| Tower height (to hub) | 80m
|
|---|
| Height to blade tip | 124m
|
|---|
| Rotational speed | 15 to 17.6RPM
|
|---|
| Rotor diameter | 88m
|
|---|
| Speed at blade tip | 69 to 81m/sec. or 249 to 292 km/hr
|
|---|
| |
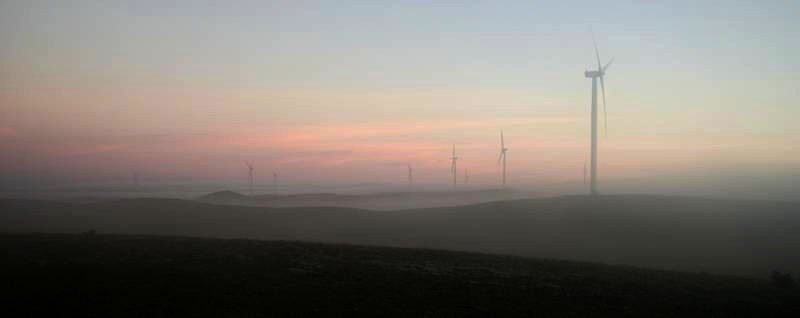
| |
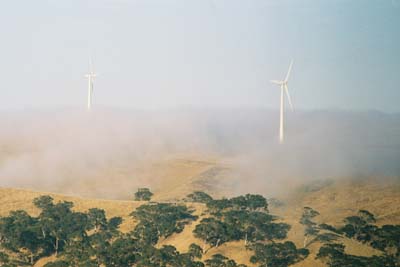
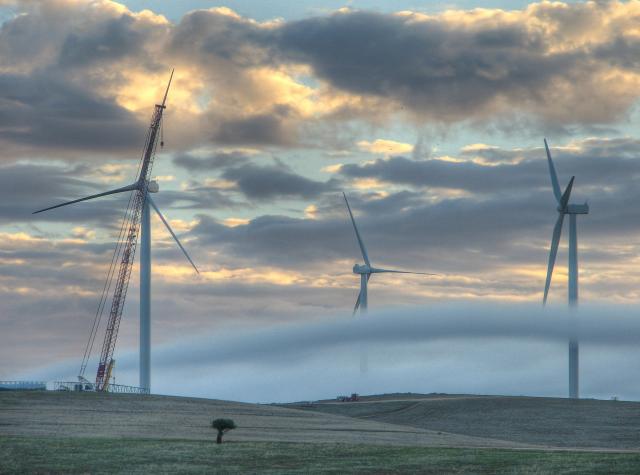
Fog streaming between turbines at Snowtown Wind Farm
2008/05/05
|
|
While Trust Power own this wind farm, the Indian based company Suzlon built
it, operate it and maintain the turbines.
The contract calls for a minimum availability of 97%; that is, as I
understand it, total turbine/hours of downtime must be no more than
3% of the total turbine/hours in a year.
The wind farm started feeding power into the grid in December 2007 and was
officially opened on 2nd November 2008.
In the Australian Electricity Generation Report of 2008, available from
Australian Policy Online, this
wind farm is listed as the eleventh largest renewable energy power station
in mainland eastern Australia,
and the fifth largest wind farm, by generation for 2008, generating
195 MWh.
Some of my photos of Snowtown Wind Farm are on
another page.
Snowtown Wind Farm had air navigation lights on about 40% of its turbines
from the time it was built.
The lights are finally to be turned off progressively through
August and September, 2011 (according to an article in the Yorke Peninsula
Country Times, 2011/08/09).
I noticed on 2012/03/01 that they were no longer on.
|
|
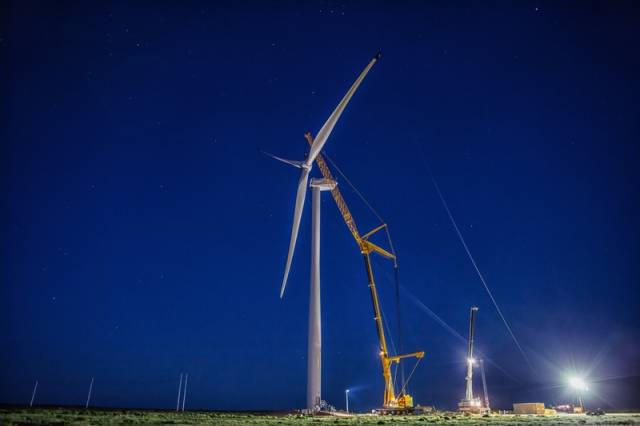
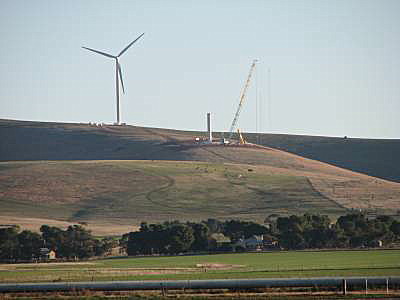
| Suzlon S95 prototype turbine under construction
|
|---|
| |
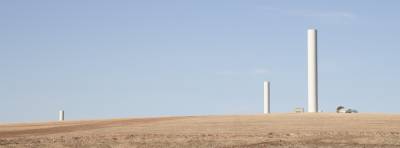
The photo on the right was taken on 2011/06/28 of the construction of the
Suzlon S95 prototype turbine.
It was operating a month or so later.
Trust Power are not generous with community funding, providing
$15 000 per year or $313 per turbine per year (less than any other
wind farm I know of other than Canunda in SE SA).
Phil Barry, CEO of Wakefield Regional Council informed me that
Trust Power was the majority funder of the wind farm tourist information
display at Snowtown and that the total project value was about
$120 000.
|
|
| Generation record
|
|---|
| | Up to end 2012
| |
The graph on the right shows the power generation record for Snowtown
Wind Farm as recorded by AEMO (Australian Energy Market Operator) and
downloaded via the ALG (Australian Landscape Guardians) Net site.
The units are average megawatts generated month by month.
The output of Snowtown Wind Farm is expected to decline by 19GWh/year (4.9%)
following construction of
Snowtown 2 due to wind shading.
Powering TREV around the world
The developers of
TREV (Two-seat Renewable Energy
Vehicle) bought power from the Snowtown
Wind Farm to power TREV on a 'Race around the World'.
TREV was expected to use 2.1 MWh of electricity in total; that is one
hour's generation from one of the Snowtown turbines at full power.
The Snowtown people are proud of their wind farm
|
|
| Sign on the highway at Snowtown
|
|---|
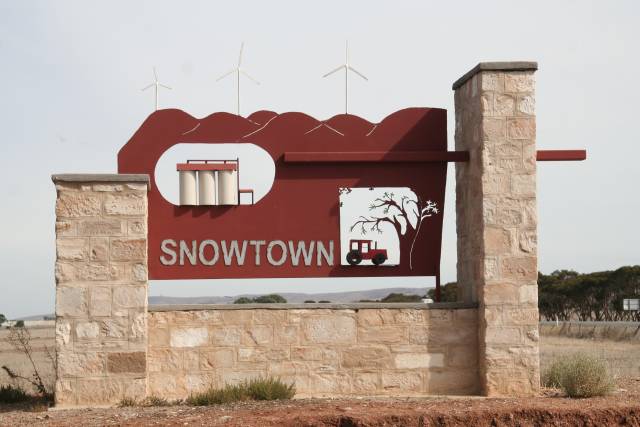
| |
The people of Snowtown, so far as I know, have always been very supportive
of their wind farm.
And they have good reason to be.
Snowtown is a small town, it is home to about 400 people, but it is doing
far more than its share in the fight against out-of-control climate change.
Snowtown Wind Farm is abating around 345 000 tonnes of greenhouse
carbon dioxide each year.
The Garnaut report showed that Australia's CO2 emissions were 28 tonnes per
person in 2006, so the Snowtown wind farm is abating the emissions from
around twelve thousand Australians!
A praise-worthy achievement for a small town.
Update 2019/12/05
Snowtown Stage 2 was sold by Tilt Renewables to Palisade Investment Partners Limited and First State Super in December 2019 for $1.07 billion "in the biggest single transaction of its type in the country"; apparently more than some expected. See
RenewEconomy.
|
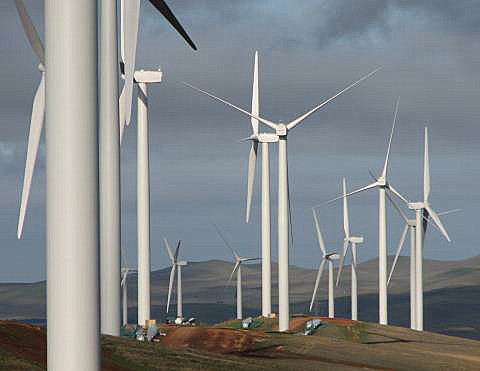
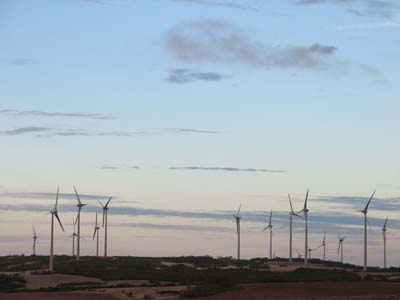
| The completed Snowtown Wind Farm, first and second stages;
2014/06/11
|
|---|
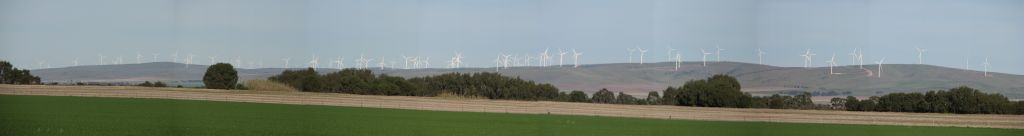
|
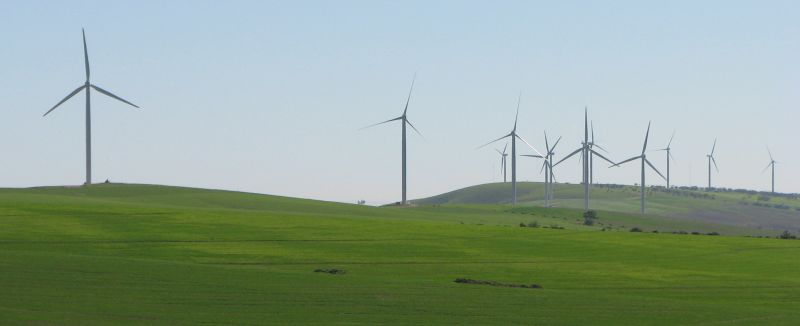
Most of the turbines of Snowtown 2 are mixed in with
Snowtown 1; the Snowtown 2 turbines have a larger diameter (the difference can be seen in the high definition image).
Most of the turbine on top of the ridge are of Snowtown 1; those on the spurs and on the far left are Snowtown 2 turbines.
Click on the image to view full size; use your browser's back arrow to come back to this page after viewing.
|
| |
| | At the official opening of the wind farm, 2014/11/02
| |
The wind farm was fully generating around the beginning of July, 2014.
Trust Power has a
Net page
for Snowtown Stage 2.
The expected capital cost was Aus$439 million.
At the end of 2012 total installed wind power in Australia was 2576MW.
This project alone increased that amount by more than 10%.
It increased the amount of installed capacity in SA by 22% (from
1205 to 1495MW) and in Mid-North SA by 44% (from 619 to 889MW).
There has been an unconfirmed report that landholders were to be paid a total
of $2.4 million per year.
This is $26 666 per year per turbine and if true is much higher than
I have heard of for other wind farms.
Trust Power would not confirm it, stating that it was confidential.
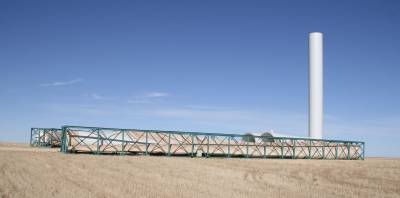
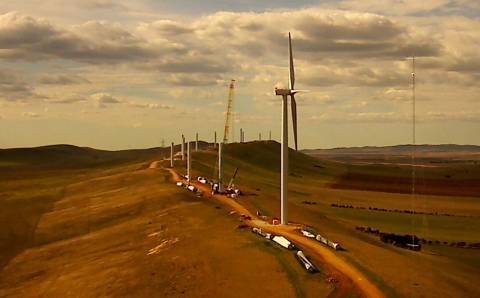
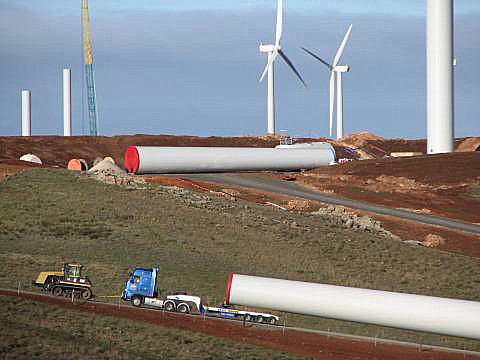
An idea of the scale of the job of transporting the tubine parts to the
wind farm site was given by the statement that "If you laid out the rotor
blades alone end to end they would form a road train about 13 kilometers long."
Combined with Snowtown Stage 1, this
wind farm will save 700 000 tonnes of greenhouse CO2 per year.
Snowtown Stage 2 summary data
| Status | No. of turbines | Manufacturer | Model | MW each
| Total MW | Construction started | Commissioned | Capacity factor
|
|---|
| Operating | 90 | Siemens | 10×S101
80×S108 | 3 | 270 | August 2012 | July 2014 | 37%
|
|
|
When Snowtown Stage 2 was built the total installed power of the Snowtown
wind farms became 371 MW, making it the biggest in SA and second biggest
in Australia.
The capacity factor above was extracted from the AEMO SA Renewable Energy
Report of 2016; it is for the 2015/16 financial year.
|
The Siemens turbines are direct drive (no gearbox) with a perminant
magnet generator, 10 turbines have a
rotor diameter of 101m and the
remaining 80 have a rotor of 108m diameter (bigger than any in
previously built in SA).
The turbines with the smaller rotors are in the areas with stronger
or more turbulent winds.
|
|
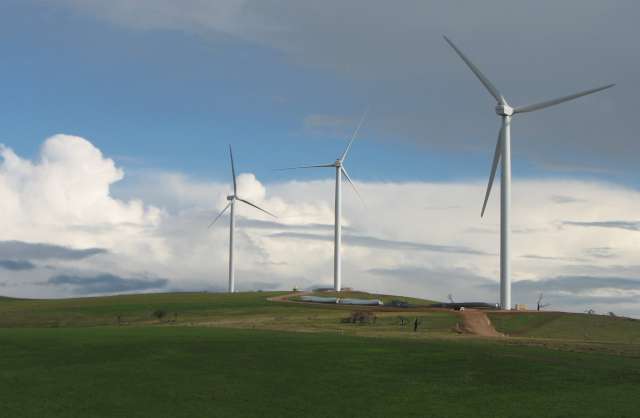
| Part of the wind farm
|
|---|
| | From the main road, 2014/11/02
| |
Clayton Delmarter of Trust Power informed me on 2012/08/06 that
"we didn't have a single submission against the project when we submitted our
planning variations and have enjoyed great support from the community".
At the sod-turning ceremony, 2012/10/25, Mayor of Wakefield Plains Council,
James Maitland,
said that he "was not aware of any negativity" regarding the project.
This contrasts strongly with strong local opposition to several other
wind farms in Mid North SA.
Trust Power ran a media release 2012/05/02 that said, among other
things:
"Trust Power has entered into a power sale and purchase agreement for the
output of Snowtown II with Origin Energy, which already has a purchase
agreement for 89% of the Snowtown 1 facility.
The Snowtown II Wind Farm, as the expansion will be known, will be located
adjacent to the existing Snowtown 1 facility and comprise 90 turbines with
an installed capacity of 270MW.
The 3MW turbines for the expansion will be supplied by Siemens.
It is intended that Snowtown Stage 2 will be split into two separately
metered wind farms, 144MW which will be owned by Trust Power and 126MW by a
co-investor.
Trust Power will be the operator for the total Snowtown wind farm site under
a long term management services arrangement.
Trust Power is currently running a targeted selection process to identify a
co-investor and hopes to make an announcement within the next few months."
The new turbines went mainly into three areas:
- Most were on the highest ridges and spurs to the east of
the original turbines;
- Around 35 were south of the southernmost of the original turbines;
- About ten filled in the gap between the two original groups.
It is not be possible for the casual observer to see
where Stage 1 finishes and Stage 2 starts.
Snowtown 2 consists of two separately
metered wind farms, Snowtown 2 North (144MW) and Snowtown 2 South (126 MW),
sharing a single transmission line owned by Trust Power.
| Expected output of Snowtown 2
|
|---|
| GWh/year | Cap. Factor
|
|---|
| Snowtown 2 North | 504 | 40.0%
|
|---|
| Snowtown 2 South | 481 | 43.6%
|
|---|
| Total Snowtown 2 | 985 | 41.7%
|
|---|
(My figure for the capacity factor for
Snowtown 1 is 41%.)
Snowtown 1 plus Snowtown 2 has a combined installed capacity of
370.8MW, making it the second biggest in Australia, following
Macarthur at 420; however, the
combined Snowtown WF is more productive than Macarthur.
It generates more power than any other Australian wind farm.
The Hallett group (operating)
is close behind at 351MW.
Trust Power are not generouse with community funding, intending to provide
$55 000 per year in total for the two stages of Snowtown.
This works out at $398 per turbine per year (less than the great majority of
wind farms in Australia).
This was owned by Transfield Infrastructure Fund, but all their
wind farms were taken over by Ratch Australia Corporation.
As of April 2016 there was an agreement between the operators and Diamond
Energy, an electricity retailing company.
|
|
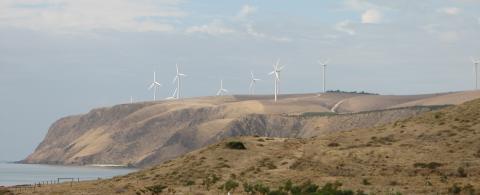
Some of the Starfish Hill turbines viewed from Cape Jervis
|
Starfish Hill summary data
| Status | No. of turbines | Manufacturer | Model | MW each
| Total MW | Commissioned | Capacity factor | Lat | Long
|
|---|
| Operating | 22 | NEG Micon | NM64 | 1.5 | 33 | September 2003
| 27% | S 35.57° | E 138.16°
|
The capacity factor figure above was taken from
AEMO data for June 2008 to December 2012 inclusive and based on the original
23 turbines.
(One was destroyed by fire on 2010/10/30.)
|
|
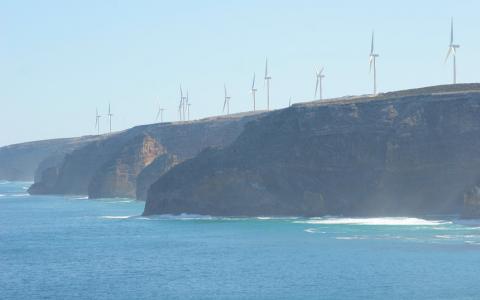
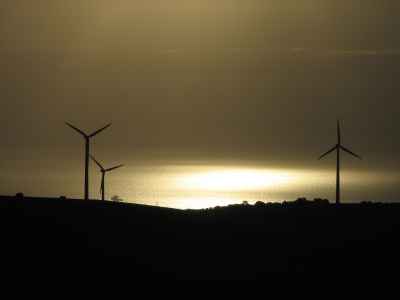
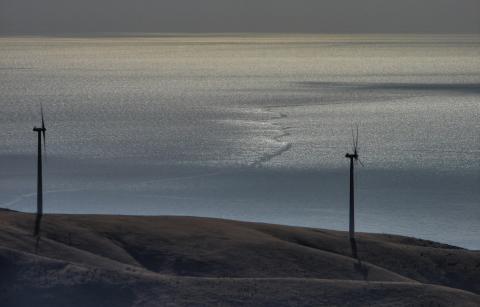
Wind turbines silhouetted against the sea at Starfish Hill, Fleurieu Peninsula
|
This was the first wind farm in South Australia.
It is located across two hills south of Rapid Bay,
Starfish Hill and Salt Creek Hill, with 8
turbines on Starfish Hill and 15 on Salt Creek Hill.
For directions to Starfish Hill go to
ExplorOz.
Further data on Starfish Hill Wind Farm
| Project cost | Aust$65 million
|
|---|
| Annual production | Approx. 100 GWh
|
|---|
| Turbine make | Neg Micon (now Vestas)
|
|---|
| Height to turbine hub | 68m
|
|---|
| Height to blade tip | 100m
|
|---|
| Rotor diameter | 64m
|
|---|
An interesting feature of this wind farm is that the tips of the turbine
blades can be rotated independently of the remainder of the blade.
This can be used to stop the turbines when needed.
Also on this Net site: Starfish Hill photos,
notes on visiting.
|
|
| Generation record
|
|---|
| | Up to end 2012
| |
The graph on the right shows the power generation record for Starfish Hill
Wind Farm as recorded by AEMO (Australian Energy Market Operator) and
downloaded via the ALG (Australian Landscape Guardians) Net site.
The units are average megawatts generated month by month.
Observations
When I visited on 2007/03/14 two turbines on Starfish Hill were out
of action; all others were operational.
I noticed in late January 2009 that three turbines, again on Starfish Hill,
were not working; all the others were.
This wind farm seems to have serious problems.
Some of the turbines made a strange sound when rotating slowly.
After a time I concluded that the turbine blades must be hollow and partly
filled with water which cascaded backward and forward as the turbines
rotated. When they rotated at full speed the centrifugal force must have
been sufficient to keep the water at the far end of the blades and stop
the cascading.
I have since been informed that it is unlikely that there could be water
in the blades, but have heard no other explanation for the strange sound.
| |
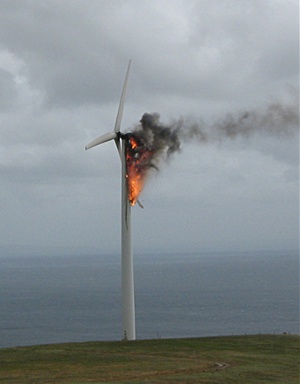
| The fire of 2010/10/30
Image credit Fleurieu Multimedia
|
|
Fire in turbine
There was a fire in one of the Starfish Hill turbines on the afternoon of
2010/10/30.
This was written up in an article in the
Victor Harbor Times on
2010/11/04.
The fire caused an estimated $3m damages.
It seems that this turbine was dismantled and not replaced following the fire.
|
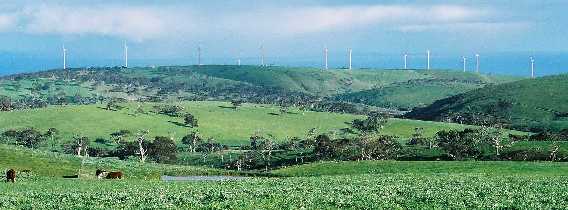
Wind turbines at Starfish Hill, Cape Jervis, South Australia
This was the first South Australian wind farm.
|
What was to be Stony Gap Wind Farm is now a part of the Goyder South section of the much bigger Goyder Renewables Zone. Early work construction started on Goyder South in January 2022
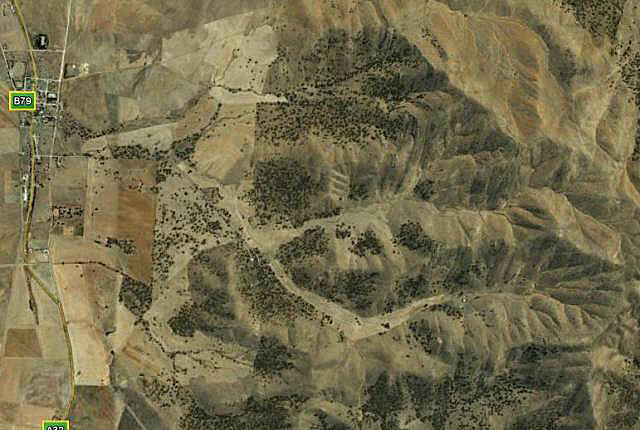
| |
| Stony Gap Location Plan
|
|---|
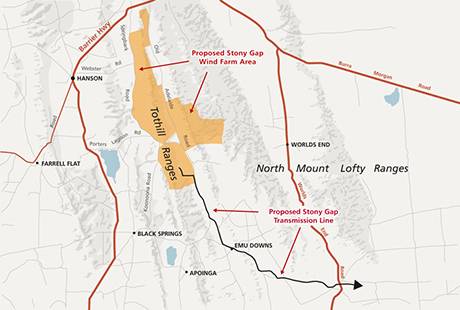
| | Image credit Energy Australia
| |
| |
|
News, March 2019
I was informed that Palisades, who had held the rights to the project for several years, had almost finalised the sale to another organisation.
|
|
Stony Gap is about 5 km south of Burra, 28 km east of Clare,
13 km east of Farrell Flat, and 126 km NNE of Adelaide.
Energy Australia was the original proposer of the project; Palisades took it over from them.
The project was started by Roaring 40s who held a community information
session on this wind farm at the Burra Town hall on 2009/12/03.
Since then, Roaring 40s was broken up and the Stony Gap WF project was taken
over by TRUenergy and later by Energy Australia.
In early 2012 TRUenergy released a locally conducted opinion survey
concerning its existing and proposed Mid-North wind farms.
More detail under
links.
This wind farm and the nearby Waterloo Wind Farm seem to have raised a more
organised than usual opposition.
Summary data from Stony Gap Wind Farm
| Status | No. of turbines | MW each | Total MW
| Construction | Lat | Long
|
|---|
| Approved | 35 | 3 | 105
| Late 2017?
| 33.81° | 138.93°
|
| |
Resolution of court case
On 2014/11/09 it was announced that the Environment, Resources and
Development Court had approved
Stony Gap Wind Farm.
No grounds on noise, health, visual amenity or anything else were found to
justify stopping the project.
The judgement is interesting in what it says about the credibility of
witnesses such as
Sarah
Laurie.
Development Assessment Panel refuses permission
On 2012/08/01 a DAP refused permission for the project on the grounds of
health related to noise – in spite there being no scientifically valid
evidence for
damage to health from wind turbines,
there being no evidence that wind turbines produce unreasonable levels of
noise and the fact
that wind power saves lives and
reduces the numbers of serious illnesses caused by air pollution from
coal fired power stations.
The decision was popular with the audience at the hearing, but went against
utilitarian (the greatest good for the
greatest number) and probably any other ethical principles.
|
|
The towers are to be 85 metres tall.
Community Liaison Group
TRUenergy have established a Community Liaison Group concerning its
Mid-North wind farms.
The group was continued by Energy Australia, meets about five times a year
and brings together many interested local people with Energy Australia staff
and experts in various fields relevant to wind power.
(I, David Clarke, the author of these pages, am a member of the group.)
| |
This section added 2017/04/13
Edited 2019/05/25
|
|
| |
News, May 2019
Sophie Vorrath reported in Renew Economy that the State Commission Assessment Panel has resolved to grant development plan consent.
|
|
This wind farm is proposed to be north-east of Kapunda; at its closest point
about 11km ENE of the town.
RES (Renewable Energy Systems) has a
Net site about the project.
In addition to the wind farm the project is to include a battery for energy storage.
There has been considerable public opposition to the project; RES have reduced the proposed number of turbines by 40 in response.
Construction was expected to create 160 jobs, with eight full-time jobs once the wind farm was operating.
RES have promised a $50,000 per year community development fund for the expected 25-year life of the project.
Twin Creek Wind Farm summary data
| Status | No. of turbines | MW | Total MW | Battery | Construction date | Lat | Long
|
|---|
| Proposed | 51 | About 3.6 | 183 | 50MW/215MWh | Undecided | Approx. S 34.24° | E 138.99°
|
The total height to the blade tip of each turbine will be 180m.
| Status | No. of turbines | MW | Total MW | Construction date
| Lat | Long
|
|---|
| Proposed | 36 | 1.65 | 59.4 | Undecided
| Approx. S 34.71° | E 137.88°
|
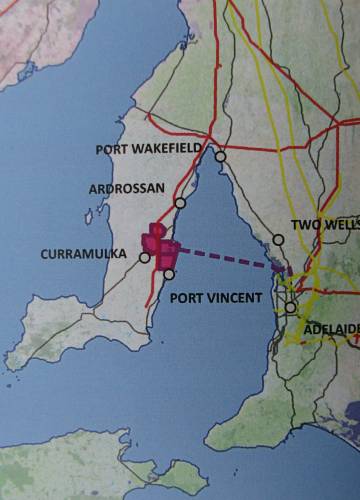
This project was proposed by Pacific Hydro and was to be at
Sheoak Flat between Port Julia and Port Vincent on Yorke Peninsula.
The company obtained planning permission for the wind farm.
On May 19th 2010 several newspapers reported that Pacific Hydro had
decided to allow planning consent to lapse.
Quoting from the Yorke Peninsula Country Times, 2008/04/15, "Currently the
132kv [power transmission] line serving Yorke Peninsula is at capacity
and, until the capacity constraints are resolved and the electricity
transmission infrastructure upgraded, this project and others like it are
likely to remain on hold."
Note that this same problem has stopped the development of Wattle Point
Stage 2 wind farm.
The SA Government talks big on sustainable energy, but does much less.
Further information on Vincent North Wind Farm...
| The project
|
|---|
| Output GWh/year | Greater than 140
|
|---|
| Greenhouse gas saving | Estimated 145 000t/yr
|
|---|
| Project cost | Aus$100 million
|
|---|
The information in this table came from
Pacific Hydro.
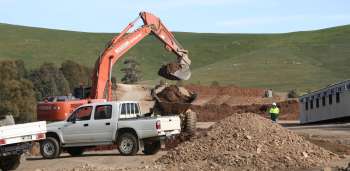
| |
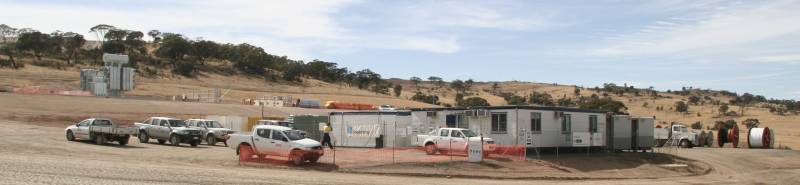
| |
Temporary construction buildings at Waterloo Wind Farm; beginning of
electrical control yard on left. 2010/02/12
|
|
| |
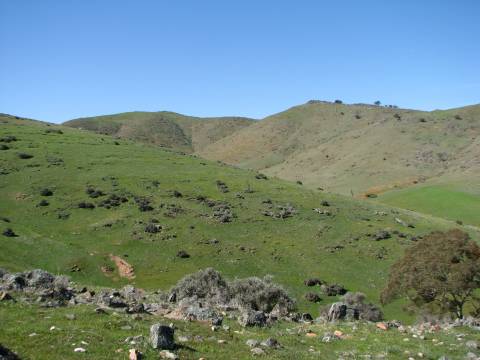
|
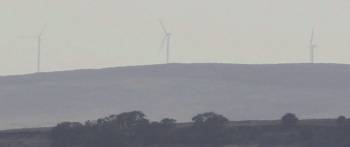
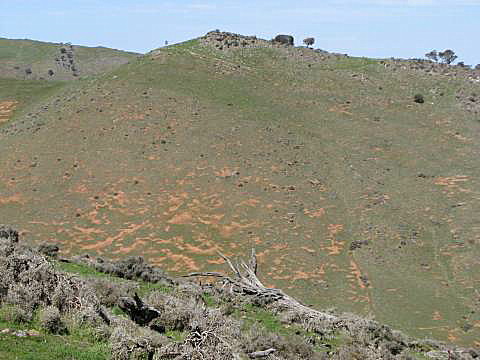
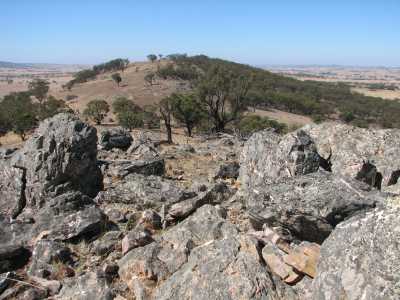
The ridge before the turbines were erected
Photo taken 2008/01/17
|
|
| |
Fire at Waterloo, 2017/01/17
A grass fire that started about a half a kilometre west of the wind farm
burned up to the top of the ridge where the wind turbines are.
Water bombing aircraft were used to help get the fire under control.
See another page on this site for more details.
|
|
Some (the first?) power from the Waterloo turbines was fed into the grid
on 2010/08/23 at 1100 hours.
By 2010/10/03 all the turbines were generating.
Waterloo Wind Farm was accepted by the EPA as fully compliant on 2011/11/22.
The township of Waterloo is 39 km south-east of Clare, 20 km
ENE of Auburn and 110 km
NNE of Adelaide.
A location map is in the notes on the
Robertstown Wind Farm.
Waterloo was constructed by Tasmania-based Roaring 40s at a cost in excess of
$300m.
In April 2011 it was passed to TRUenergy, who later changed their name to
Energy Australia.
By 2017 the majority owner and manager was Palisades.
The wind farm uses Vestas Wind Systems V90-3.0 MW turbines.
(The V90 is an abbreviation: V for Vestas and the 90 indicates a 90m
diameter for the swept circle of
the turbine blades.)
On 2010/08/19 Dijana Jevremov of Roaring 40s informed me that the closest
turbine to a residence at Waterloo Wind Farm is "at or near to 2 km away".
A battery?
At a meeting of the Waterloo Wind Farm Community Liaison Group on 2017/08/22
Steve Brown of Palisades mentioned that a 50MW/50MWh battery at the wind farm
was being seriously considered.
Waterloo summary data
| Stage | Status | No. of turbines | Manufacturer | Model | MW each
| Total MW | Capacity factor | Completion | Lat | Long
|
|---|
| 1 | Operating | 37 | Vestas | V90 | 3 | 111 | 32%
| October 2010 | 34.00° | 138.92°
|
| 2 | Operating | 6 | Vestas | V90 | 3 | 18 | ?
| Late 2016 | 34.06° | 138.91°
|
| 1+2 | Operating | 43 | Vestas | V90 | 3 | 129 | ?
| Late 2016 | |
|
|
The capacity factor was calculated from AEMO data for October 2010
to December 2012 inclusive.
|
|
|
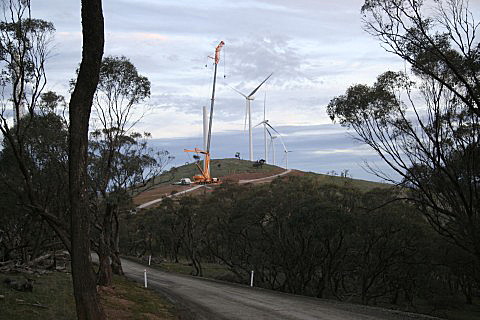
| |
Photo taken 2010/06/24
The 690-tonne crane is in place to add the top sections to the part-tower.
As can be seen, there are quite a few native trees on this ridge, it is
a pity that a number had to be
removed.
Roaring 40s have an off-set arrangement with the Native Vegetation Council
in which $800 000 will be paid toward revegetation and conservation
programs.
They are also using sterile rye grass and seven local native grass species to
cover areas disturbed during construction.
|
|
Further data on Waterloo Wind Farm Stage 1
| Turbines
|
|---|
| Turbine type | Vestas V90 3 MW
|
| Tower height | 80m
|
| Blade length | 44m
|
| Weight of each blade | 6.7t
|
| Tower weight | 145t
|
| Nacelle weight | 70t
|
| Hub and nose cone weight | 22t
|
| Foundations
|
|---|
| Concrete used | 360 cubic m each
|
| Steel reo used | 30t each
|
| Total weight | 910t each
|
| Cables
|
|---|
| Buried aluminium | 28 km
|
| Buried optical fibre | 28 km
|
|
|
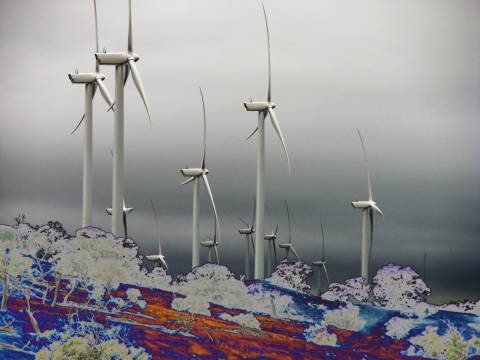
| | Waterloo turbines; colours altered digitally
|
|
Roaring 40s erected a wind monitoring tower in 2002 to investigate the
wind potential of the site.
The turbines are along the top of a well defined sharp ridge
running parallel to, and four kilometres west of, Tothill Range.
The point specified by latitude and longitude in the table above is in
the approximate centre of the
wind farm and is about 3.5 km east of Waterloo.
Waterloo is about 30 km SE of Clare.
An interesting point about this wind farm is that the turbines are
43% bigger than most of those previously constructed in northern South
Australia; ie. 3 MW rather than 2.1 MW.
(3 MW turbines have also been used at
Lake Bonney Stage 3 Wind Farm.)
On the grape vine: The quartzite rock on the ridge is so hard that it has to
be blasted before footings can be built.
However, it is generally too fractured for rock anchors to be used, so the
footings are of the heavy gravity type.
The SA EPA found the Waterloo Wind Farm to be compliant with state wind farm
permissible noise levels in late 2011.
Energy Australia are working toward two other wind farms in the area,
Stony Gap and
Robertstown.
In early 2012 Energy Australia released a locally conducted opinion survey
concerning its existing and proposed Mid-North wind farms.
More detail under
links.
Community Liaison Group
TRUenergy have established a Community Liaison Group concerning its three
Mid-North wind farms.
The group meets every two or three months and brings together a number of
interested local people with Energy Australia staff and experts in various
fields relevant to wind power.
(I, David Clarke, the author of these pages, am a member of the group.)
|
|
| Generation record
|
|---|
| | Up to end 2012
| |
The graph on the right shows the power generation record for Waterloo
Wind Farm as recorded by AEMO (Australian Energy Market Operator) and
downloaded via the ALG (Australian Landscape Guardians) Net site.
The units are average megawatts generated month by month.
Two pairs of wedge-tailed eagles have been nesting on the ridge on which the Waterloo Wind Farm turbines have been built on for getting on toward nine years (this note was added in August 2019).
| |
May 2016
A press release concerning the Waterloo Wind Farm Community Grants Program
stated that "the amount of funding this year will be $30,000 (up from
$20,000 last year".
|
|
I will quote an email kindly sent by Sarah Stent, Corporate Affairs Manager,
Energy Australia:
"In the past year, allocation by Waterloo wind farm to community has been
driven by strategic partnerships, rather than via a 'Community Fund'.
This included major contributions of;
- $27,000 for the Community Information Shelter at Waterloo;
- $7,500 for the CFS to purchase a generator;
- $17,500 for Clare races event;
- $12,500 to the CSIRO study of social licence.
In addition, there was support of smaller events such as the Saddleworth
Christmas party (approx 1-2k) and the ($4k) Swimming Australia learn to
Swim classes at the Clare pool.
This year, funding will be predominantly allocated via the Community Fund
– $20,000 over the year.
Further to this we plan to allocate $5,000 funding to the set up and
development of community bus tours of Waterloo and the training of a tour
guide.
There is then also the Retail Offer which is now available to all residents
and businesses in the region, offering a 14% discount.
We support the lodgement of a grant for the SEB grant.
We will also look to host an open day later in the year.
Funding for the ongoing CLG will continue as will community advertising to
ensure wider community is aware of our actions and priorities.
If the CSIRO study is reinvigorated, we may also extend further funding to
this."
So, the total for the year listed above is $64 500.
This is $1740 per turbine, well above the average for SE Australia (around
$1000).
Excluding the $12 500 for the CSIRO funding, which did not go to the
local community, the total was $52 000, or $1405 per turbine for the
year; still well above average.
A second stage added six more turbines (18 MW additional
installed capacity) at
the southern end of the existing farm, from Steelton Road.
This was given approval by the Clare and Gilbert Valley Council in mid
June 2013.
The second stage was completed in late 2016.
| |
|
A wind farm opponent, Michael Cobb, wrote a litterally incredible piece about
Waterloo Wind Farm in the Blayney Chronicle on 2012/11/01.
He claimed he was unable to talk to wind farm hosts because of 'gag clauses';
this is quite false – I have talked quite freely to a Waterloo turbine
host a number of times.
Ketan Joshi wrote a reply to Cobb's piece on 2012/11/25.
| |
A Michael Cobb has been found guilty of fraud and fined $14 000; more
on this in Joshi's piece, above.
I cannot be sure that it is this Michael Cobb, but it seems likely.
It is relevant and fair to mention it here because it bares on Mr Cobb's
honesty and credibility.
|
|
There seems to have been a more emotional reaction to the Waterloo Wind Farm
than to most others, but perhaps it is simply that the opposition in this
area is more organised and vocal than elsewhere.
I believe that most of the activity is coming from a small group of six or
so people.
(There have only been five formal complaints sent to Energy Australia about
the wind farm.)
It has been claimed that several houses have been abandoned at Waterloo
due to the wind farm.
However, evidence given at the hearing in Clare of the SA Parliamentary
Committee Inquiry into Wind Farms, suggests that the houses may well have
been vacated due to
loss of employment
at the local quarry.
The email below was sent by one of the opponents of the Waterloo Wind farm
and seems to be encouraging people to lie about loss of
sleep and illnesses caused by Waterloo Wind Farm.
(I originally did not give the name of the sender, but when it was published
in Adelaide Now I saw no reason to not include it here.)
Invitation to lie?
"From: Mary Morris
Sent: Wednesday, 5 September 2012 12:44 PM
Subject: URGENT AND IMPORTANT - SEND NOISE /HEALTH COMPLAINTS TO CLARE AND
GOYDER COUNCIL
GOYDER COUNCIL SAYS IT HAS RECEIVED NO WRITTEN NOISE OR HEALTH COMPLAINTS
REGARDING THE WATERLOO WIND FARM.
They have the power to shut the wind farm down and get the noise nuisance
investigated.
LETS DO IT!!!
Please send in a written complaint to both the Goyder Council and Clare
Council
All it has to be is a simple letter stating that the noise and vibration is
causing a serious disturbance to sleep and rest, and/or that people are
becoming sick – mention elderly and frail people AND children as well
especially if this applies to you.
If you have already sent in a letter, send again with a cover note that you
wish your submission to be considered as a formal complaint about the effects
of the Waterloo wind farm.
Goyder council@goyder.sa.gov.au
Clare and Gilbert Valley admin@cgvc.sa.gov.au
Need help?? Let me know"
|
Mary Morris was inteviewed on radio in regard to a
night spent beneath the
Waterloo turbines by SA Greens MP Mark Parnell.
She said on this program that she lives 17km from the turbines, but when her
children get headaches and earaches she blames them on the turbines.
Two surveys
|
|
Zhenhua Wang's survey
Professor Mike Brooks, Deputy Vice-Chancellor (Research), University of
Adelaide distanced the university from Mr Wang's work, saying that Mr Wang
did the work in his own time and not for the University.
I emailed Mr Wang (2012/03/01) asking for more information on his survey;
I did not receive a reply.
It is curious that Mr Wang's research seems to have been made
available to anti-wind people:
- WindWatch, a Net based
anti-wind power group;
- a member of the Mid North Wind Farm Liason Group who strongly opposes
local wind farms;
- and Graham
Lloyd of The Australian;
but not to me, nor any other pro-wind power people who I know of.
|
|
A survey done by a masters candidate at Adelaide University, Zhenhua (Frank)
Wang, sought responses from 75 people who lived within five kilometres from
the wind farm.
Mr Wang reported a 64% response rate, that 70% of "respondents claimed they
had been negatively affected by the wind farm noise", that "35% of the
respondents had been 'moderately affected' and 19% claimed they had been
'very affected'".
It is interesting to contrast the results of Mr Wang's survey with another
survey carried out by Qdos Research and commissioned by Energy Australia
(then called TRUenergy).
The results of this community survey were released in March 2011.
It involved 358 people living near the Waterloo Wind Farm and the proposed
Stony Gap
and Robertstown wind farms.
The survey indicated that 66% of respondents were concerned about climate
change, 77% supported wind farms, 69% supported nearby wind farms, and
a majority saw wind farms as positives for: appearance, tourism,
local business, short term jobs, local economy and landholder income.
As Energy Australia own and operate the Yallourn coal-fired power station,
which is far larger in power generation than are their wind farms, there
seems no reason to believe that Energy Australia should be biased toward
renewable energy.
In fact I believe that Energy Australia lobbied the government to reduce
the Renewable Energy Target.
The South Australian Environmental Protection Agency (EPA)
produced a
report titled "Infrasound levels near windfarms and in other
environments" in January 2013.
While this research was not conducted at Waterloo, it is very relevant to
the allegations that have been made about this wind farm.
On 2013/11/26 the EPA reported on a noise study they had done over a ten-week
period from April to June in 2013.
In this study the EPA arranged with a number of residents who lived near the
wind farm to keep diaries in which they recorded their level of annoyance
from the wind farm.
A summary of the EPA's findings was available on the EPA site, but is no longer.
Because of the significant controversy around the Waterloo Wind Farm I will
copy the summary of the findings of the EPA study here:
-
Noise events that could be attributed to the wind farm were periodically
audible at four locations, but at very low levels, which did not dominate the
noise environment; however, no attributable events were found at the two
remaining houses.
-
Where detectable, noise levels from the wind farm were found to comply with
criteria in the EPA Wind Farm Environmental Noise Guidelines.
-
Wind farm operation was shown to contribute to the low frequency content of
noise under some operating and environmental conditions, resulting in an
increase in relevant low frequency noise descriptors
-
In those houses where infrasound was monitored, a 'blade pass frequency'
component was found at levels significantly below the accepted perception
threshold of 85dB(G).
-
Background noise resulting from local winds and other noise sources, was
shown to contribute to increases in low frequency noise that were comparable
with, or higher than contributions from the wind farm.
-
A 'rumbling' effect was found using diary records to focus the analysis,
which could only be heard with amplification of audio records; however, in
many cases, the EPA was unable to determine that described events could be
attributed to the turbines; and at times reported events coincided with
shutdowns of the plant.
-
Some degree of modulation was detected, which may have been perceivable at
times by residents.
-
The rumbling and other low frequency characters found in this study would
not generally be audible to a typical listener, but it is possible that
sensitive people living within this very quiet area may hear them.
This could cause annoyance to some people if exposed to the noise for
prolonged time periods.
Peter Dolan of the EPA was later reported on the ABC North and West
radio program saying that this study indicated that noise from
the wind farm was not significantly impacting on the local people.
He said that the entries in the diaries did not correlate with the levels
of sound from the wind farm.
Some anti wind-power reporting
Graham Lloyd,
'Environment Editor' of The Australian wrote a particularly
ill-informed article on Waterloo
Wind Farm that was published on 2012/04/21.
Threats, abuse
I have received abusive emails from one Waterloo resident who accused me
of "lies and misleading the puplic (sic)" and from another who called me
a "death camp Natzi" (sic).
(As stated elsewhere on these pages, I am always pleased to have people point
out any errors that I have made, so long as they give convincing evidence
for their claims.
To get some personal experience I went to the Waterloo wind farm on the
evenings of 2012/02/09 and 2012/02/14 and set up my swag beneath one of the
turbines (a different section of the wind farm on each occasion).
The number of kangaroos on the ridge impressed me; I must have seen at least
eight, including a small joey.
I also saw a pair of wedge-tailed eagles circling near the turbines.
All were apparently in good health.
On both nights the wind varied from a moderate to a stiff breeze, so the
turbines were operating all night.
While I could plainly hear the turbines whenever I woke at night, I had no
problem at all in getting a good night's sleep.
Right at the foot of the turbine the sound of the turbine gear-box dominated
the sound of the blades as they passed through the air.
I noticed that when I moved away 100m or more all I could hear was the blades.
On both visits I stopped in Waterloo township to listen for the turbines in
the evening before going
to the wind farm and in the morning after leaving the wind farm.
With the possible exception of the first morning I could not hear them.
When there was a breeze in the nearby trees the sound from this would have
drowned-out any sound from the turbines.
In both mornings there was very little breeze in Waterloo while there was a
good breeze on the ridge.
On the first morning I thought I might just be able to hear the turbines,
but could not be sure; birds were making far more noise than the turbines.
I have written more about my personal experiences sleeping at or near wind
farms elsewhere.
|
| |
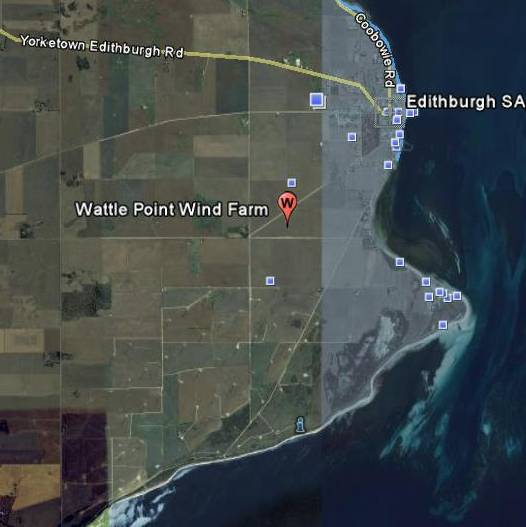
| Wattle Point Wind Farm location
|
|---|
|
Wattle Point Wind Farm can be seen in the lower section of
this Google-Earth image.
Each dot at the end of a little road is a turbine.
The information station is on the road running due south into the farm.
| |
A 55-turbine wind farm at Wattle Point near Edithburgh on Yorke Peninsula.
Edithburgh is 80 km
WSW of Adelaide
as the crow flies, but about 230 km by road around the
northern end of St. Vincent Gulf.
For directions to Wattle Point go to
ExplorOz.
The wind farm started operating in the first half of 2005.
Alinta sold this wind farm to a wholly-owned subsidiary of the ANZ,
Energy Infrastructure Trust, in April 2007 for Aus$225m.
It is run by AGL.
The Google-Earth image at the right shows the locations of individual
turbines and a number of the access roads.
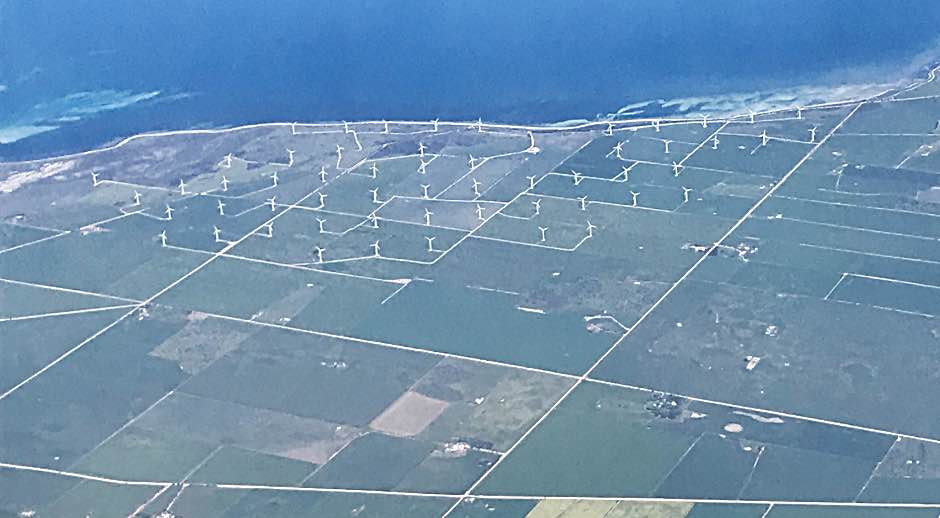
Wattle Point is unusual in being (as of late 2009 at least) the only large
Australian wind farm laid out in a grid-pattern on level ground.
It would be interesting to know how much wind-shadowing there is due to
this lay-out.
In the Australian Electricity Generation Report of 2008, available from
Australian Policy Online, this
wind farm is listed as the eighth largest renewable energy power station
in mainland eastern Australia,
and the third largest wind farm, by generation for 2008, generating
248 MWh.
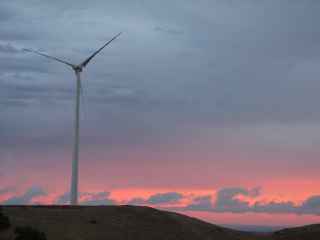
|
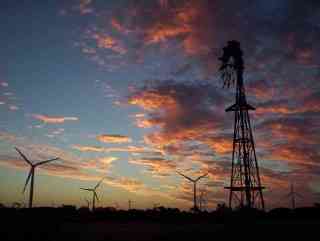
| Sunset at Wattle Point Wind Farm
|
Summary data, Wattle Point Wind Farm
| Status | No. of turbines | Manufacturer | Model | MW each
| Total MW | Completed | Capacity factor | Lat | Long
|
|---|
| Operating | 55 | Vestas | V82 | 1.65 | 91 | May 2005
| 33% | S 35.10° | E 137.72°
|
The capacity factor was taken from AEMO data, via the ALG Net pages,
and is from data from June 2008 to December 2012 inclusive.
|
|
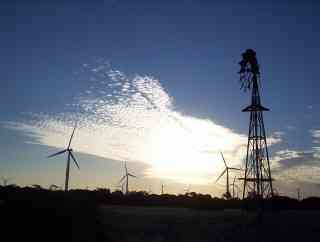
| |
Old and new windmills at Wattle Point
| |
Additional data on Wattle Point Wind Farm
| Type of turbine | Vestas V82
|
|---|
| Total area of wind farm | 11.5 square kilometres
|
|---|
| Tower height | 67m
|
|---|
| Blade length | 40m
|
|---|
| Height to blade tip | 110m
|
|---|
| Expected life | 25 years
|
|---|
| Expected annual generation | 312 GWh
|
|---|
|
312 GWh/annum was roughly 2% of South Australia's electricity at the
time Wattle Point was built.
The above data were from
Research
Institute for Sustainable Energy, (RISE).
|
| |
| Generation record
|
|---|
| | Up to end 2012
| |
The graph on the right shows the power generation record for Wattle Point
Wind Farm as recorded by AEMO (Australian Energy Market Operator) and
downloaded via the ALG (Australian Landscape Guardians) Net site.
The units are average megawatts generated month by month.
I noticed on a visit in late September 2010 that there were no lights on
any of the turbines.
It appears that there is no community fund associated with Wattle Point
Wind Farm.
In September 2010 I took sound level readings among the turbines in a light
breeze.
The highest reading was 47dB(A) and I noted at the time that a car travelling
at an estimated 60 km/hr 400m away was making more noise.
More photos are at
my Wattle Point photos page;
also see my notes on
Visiting Wattle Point Wind Farm.
|
I've flown over southern Yorke Peninsula quite a few times when travelling between Adelaide and Perth. This is the best view I've had of Wattle Point Wind Farm from the air.
|
Alternatively known as Troubridge Point Wind Farm
This was proposed to be a 25 MW wind farm near the present Wattle Point
farm.
At least to October 2008 it has not been built.
The hold up seems to be the lack of capacity in the transmission lines.
Following an inquiry I sent to the District Council of Yorke Peninsula
I received the following by email...
Please be advised that Council have approved of a second wind farm near
Wattle Point a couple of years ago, however, the development has not
proceeded due to the fact that there is insufficient capacity in the
transmission lines to accommodate additional power loadings.
Until such time that there is an extensive up grade to the existing
transmission lines, which would cost the state government millions of
dollars, the development will not occur.
I trust that this information answers you enquiry.
Regards,
ROGER S BROOKS
ACTING DIRECTOR DEVELOPMENT & COMMUNITY SERVICES
District Council of Yorke Peninsula
roger.brooks@yorke.sa.gov.au
www.yorke.sa.gov.au
More recently (October 2008) I have had confirmation from another source
(I will not give the name) that the reason this farm was not built was
a lack of support by the State Government.
So it seems yet again that a wind farm development that could happen is
not going to happen because of lack of the needed government support, in
this case, state government
support.
This project is proposed by
Infigen Energy who own the
nearby Lake Bonney Wind Farm.
Infigen Investor Relations sent me links to two MP3 files, on 2010/12/15,
of interviews with Frank Boland, Infigen Project Manager, who was speaking
about the Woakwine Wind Farm.
Together with the wind farm size data and probable construction date
given in the summary table below, he said that the cost of the project
was expected to be greater than $800m.
He said that the northern section would comprise 49 turbines and go from
Cape Jaffa to Mount Benson, the largest, southern, section would go from
Mount Hope to Lake Bonney (98 turbines), and there would be another six
turbines near Robe.
He also said that the closest turbines to houses of people without a
financial connection to the wind farm would be 600 to 700m away.
Infigen seem to have little information about the project on their Net pages
as of 2011/12/10.
Summary data, Woakwine Range Wind Farm
| Status | No. of turbines | MW | Total MW | Construction date
|
|---|
| Approved | 153 | 3? | 450 to 540 | Unknown
|
The last council to give approval was Wattle Range, who approved
the project on 2012/06/07
Approximate locations of the sections of Woakwine Range Wind
Farm
| Section | Latitude | Longitude
|
|---|
| Northern | S 37.01° | E 139.76°
|
| Robe | S 37.18° | E 139.75°
|
| Southern | S 37.56° | E 140.23°
|
Infigen had a pdf file on its 'Australian development pipeline' (no longer
available) that mentioned the project.
The power transmission network in the region is already
strugling to handle the load from the existing wind farms; it will need
substantial development before this project can be brought online.
| Status | No. of turbines | MW | Total MW | Construction date
| Lat. | Long.
|
|---|
| Proposed | 90? | 2? | 180 | Undecided
| S 33.83° | E 139.05°
|
The Burra
Broadcaster published a front page article on 18
th
August, 2004 stating that a company named Wind Developments Australia
Pty. Ltd. were planning to build an 80 to 90 turbine wind farm at
World's End (about 15 km South of Burra); each turbine being 2 MW.
The newspaper also stated that
construction was expected to take about eight months and the
Company hoped to start construction by the end of 2004.
This seems to me one of the least likely of the Mid-North SA wind farms
to be built.
There is no evidence that I know of for any action at all on the project,
and I have been told by someone in a position to know that the turbine
sites are inappropriate for efficient operation.
Allco Financial
Services listed this as one of their projects.
Allco, in severe financial difficulties, called in administrators in
November 2008.
In addition to those detailed above many others wind farms are proposed
(table below).
For every wind farm built, five have been proposed.
The projects on this list are either highly speculative or in their very
early days.
Information concerning these would be appreciated, my email
address is at the
top of this page.
If and when any of these proposed wind farms look likely to be built I
will write them up in more detail.
Until some significant money is spent on investigation a proposed wind
farm may be little more than wishful thinking and is not worth covering
in more detail than that below.